Single-Cell Barcoding: Another way to understand the behaviour of a cell population
Since the cells were discovered with the advent of the microscope in the late seventeenth century, scientists have tried hard to find out what is going on into them. An avalanche of techniques and technologies emerged over the course of decades slowly discovering important molecular features of the cellular world to our knowledge and our health. Until recently, most of those experimental approaches have gained valuable conclusions from results that are averages obtained from a big population of cells by means of pooling together the content of many of them. Accordingly, much of what we know about the biology of the cell is an image of the overall statistical behaviour of billions of molecules coming from thousands or millions of cells. However, these powerful approaches tend to hide not only the existing heterogeneity between cell types but also the recently evidenced heterogeneity within cells from the same type. A fact that if understood could help to explain the behaviour of a cell population from its base.
Aware of that, a number of approaches exploiting the development of device miniaturization appeared aiming to study biochemistry and molecular biology at single cell level. Most of them handle single cells like a fruit seller handles apples. They are incredibly accurate and able to compartmentalize volumes in the nanoliter range. For example, they have been extremely useful for single cell genome sequencing, quantitative assessment of gene expression and for physically separate subpopulations of cells attending to certain molecular markers. Nevertheless, the single-cell handling may not always be the best option for some single-cell studies because of the increase in experimental complexity or excessive economic costs. To circumvent those drawbacks several kinds of single-cell barcoding have being developed in the last years using a host of different molecular beacons assigned to cells through random processes, which makes almost impossible the same combination for two different cells.
Here today, I would like to highlight a paper presented last May as an example of this concept. The present research presented by Cusanovich et. al. 1 aim the single-cell profiling of chromatin accessibility. Chromatin accessibility is a key but yet ill-defined controller for gene expression and genetic recombination. Current research for its understanding spans from studies about its three-dimensional structure to accessibility mappings using enzymatic digestion (e.g with DNAse I) or transposase-accessible chromatin assays (ATAC-seq; Figure 1). The rationale behind those mappings is that open chromatin is prone to bear more active genes because is more accessible for transcription factors and RNA-polymerases; and for the very same reason it is more accessible to any kind of DNA-related enzymatic activity susceptible of being quantified like DNA restriction or PCR.
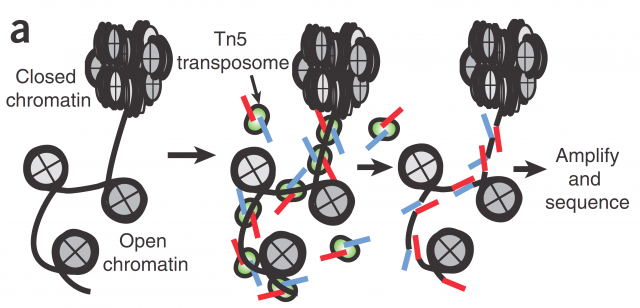
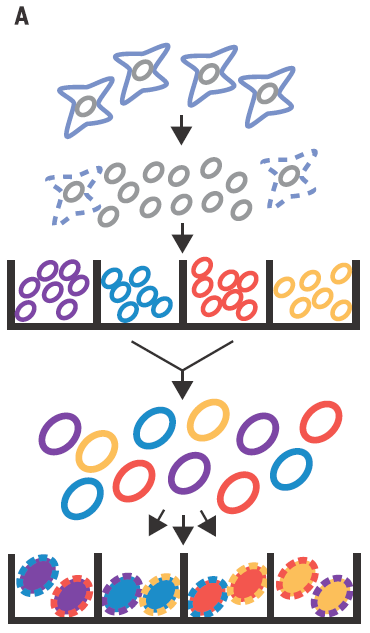
In Cusanovich´s work they use ATAC-seq technic to map the accessible chromatin, not in the pooled chromatin from a cell population but in single cells by mean of barcoding their intact nuclei. They achieve that through tagging pools of nuclei with different barcoded Tn5 transposases and diluting then for later making PCRs with indexed primers complementary to the adapters introduced by transposase (Figure 2). Just by probability most nuclei will pass through a unique combination of tagged primers that will make them singular and traceable. Therefore, those PCR products coming from the same cell would have the same exclusive barcode, being a library of regions of a single-cell genome that are accessible and free of nucleosomes. Finally, for knowing the accessible regions on each cell, massive sequencing from the whole pooled set of PCR products is performed.
As proof of principle it is shown that the technique is able to properly assign the cell lineage in more than 90% of the single-cell libraries according with their chromatin accessibility profile, no matter if they come from equal mixtures of two cell types from two different species or different cell types from the same species. This simple but smart setting easily reach a high number of possible tag combinations making possible to differentially barcode several thousands of cells per experiment. Nevertheless, in the PCR step, most of the barcodes receive only very few reads being discarded and only those barcode combinations having more than 500 reads are taken into account. Because of that, heterogeneous mixtures having different amounts cells for each cell type could be more difficult to handle, losing in the less represented population much of the information necessary to estimate its chromatin accessibility.
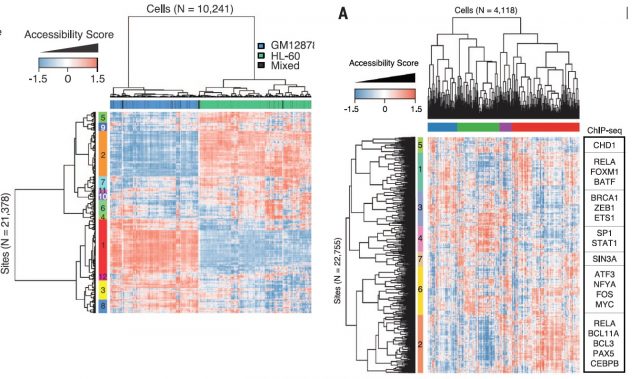
In order to solve that, they defined the DNase I hypersensitive sites (DHSs) for each cell-type mixture using the available published data and calculated their Jaccard distances between shared DHS for each cell type. Afterwards, using these distances, multidimensional scaling with the single-cell ATAC-seq data (that just to overlap with DHSs) could properly locate the single cells within their cell-types. All that leave the notion that the ability to discern between cell types is proportional to number of reads per cell but yet a successful clustering could be achieved just based on the use of very few shared DHS within a cell type. Thereby, optimizing the experimental conditions for increasing the number of reads per cell, applying latent semantic indexing for identify patterns within DHS distances matrix and linking differentially chromatin accessible regions from single cells to the genes they putatively regulate, they show that this method is able to separate two cell types in different clades identifying the subgroup of accessible chromatin regions behind that separation. (Figure 3, Left panel). Furthermore, the method is able to assess the variability between cells from the same type, whose panorama of chromatin accessibility (therefore, potentially expressed genes) is rather heterogeneous, reflecting the potentially unique state of that single cell within its population (Figure 3, Right panel).
All over, this work seemingly accomplishes several major interesting points. To the technical side, it brings a hitherto non-existent technology for characterising single-cell chromatin accessibility. In a magnificent example of what a smart and simple wet–lab setting helped by appropriate mathematical implementations may become, this single-cell barcoding method seems away cheaper and more scalable (able to afford more single cells) than its putative micro-compartmentalized equivalent. To the understanding of cell populations provides strong evidence of the expected heterogeneity regarding the accessibility of chromatin, which has important potential implications for understanding achitecture and control of the gene expression in complex tissues and organisms. Additionally, this work seems to consolidate the methodological concept of single-cell barcoding, which could be an extraordinary source of information about how cells work and how they are integrated into the tissue. Thus, having promising applications to human health as you can already see in another work2 last May. There, a different modality of single-cell barcoding is used for testing whether intratumoral heterogeneity could act as a source of therapeutic resistance or that resistance rises from de novo alterations during the treatment.
References
- Cusanovich, D. A. et al. (2015) Multiplex single-cell profiling of chromatin accessibility by combinatorial cellular indexing. Science DOI: 10.1126/science.aab1601. ↩
- Bhang, H. C. et al. (2015) Studying clonal dynamics in response to cancer therapy using high-complexity barcoding Nat. Med. DOI: 10.1038/nm.3841) ↩