Graphene nanodrum solos
Luthiers still use Chladni figures in the design and construction of acoustic instruments such as violins, guitars, and cellos. The technique invented by the German physicist and musician Ernst Chladni (1756–1827) shows the modes of vibration under forcing. The backplate of the instrument is covered with flour or sand, and bowed until it reached resonance. The grains move and concentrate along the nodal lines where the surface is still, outlining the vibrational modes. A similar technique can be used for quality control of membranes of suspended two-dimensional materials, like graphene. Small imperfections deform the nodal lines for the higher modes. Their study is crucial for reproducible fabrication and applications.
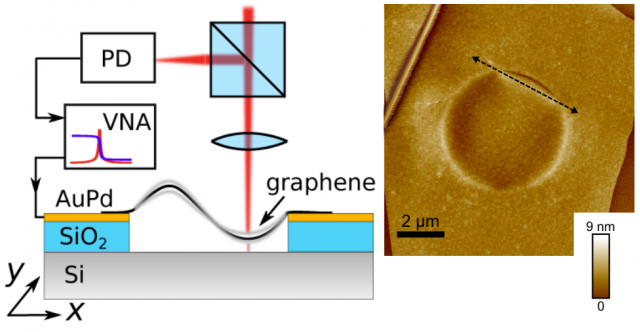
The nanoscientist Dejan Davidovikj, Delft University of Technology, Delft, The Netherlands, and colleagues have developed a technique for visualizing up to the eighth vibrational mode of a circular graphene membrane 1. The nanodrum was fabricated by transferring exfoliated few-layer graphene on top of silicon substrates prepatterned with circular holes. It has a diameter of 5 μm, a thickness of 5 nm, and a mass of 230 fg. The flexural motion of the nanodrum was detected using a phase-sensitive scanning interferometer with a spatial resolution of 140 nm and a displacement resolution of 11 fm/(Hz)1/2. The drum is probed by a Helium−Neon laser (λ = 632.8 nm) with an incident power of 0.8 mW. The experimental setup is shown in Figure 1 (left). The measurement consists of 1500 data points spatially distributed across the suspended part of the drum.
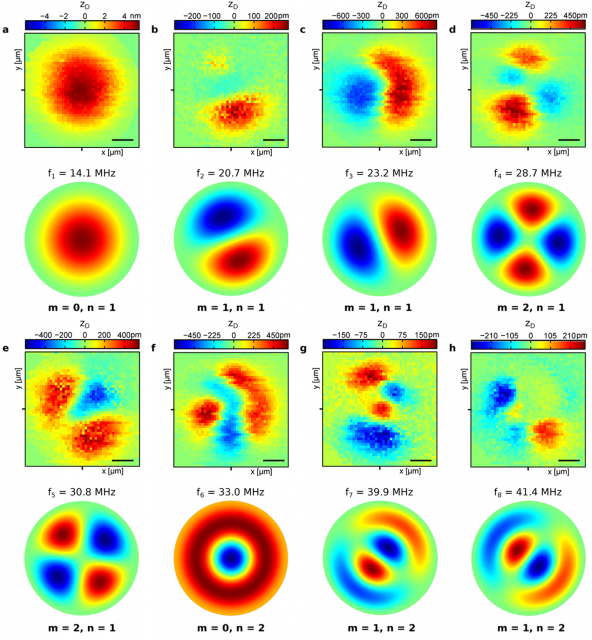
The shape of the first eight resonance modes are shown in Figure 2 (panels a−h), together with the theoretical calculations using the finite-element method. The modes are indexed f1−f 8 starting at the fundamental mode. The profiles of modes 1−4 (panels a−d) show reasonable agreement with the theoretically calculated mode shapes, but other modes show large discrepancies resulting from imperfections in the nanodrum.
These local inhomogeneities in the membrane are not visible in the scanning electron microscope images. However, they are in the map of local stiffness of the drum obtained by using a peak-force, atomic force microscope (see Figure 1, right). A wrinkle-like feature is observed which introduces a source of uniaxial tension along its direction. A finite-element calculation that takes this feature into account results in a better agreement between the predicted mode shapes and the measurements, including an explanation of the unusual shapes of mode f6 in Figure 2, which loses its radial symmetry, and mode f5, which shows merging of two anti-nodes along the diameter of the drum.
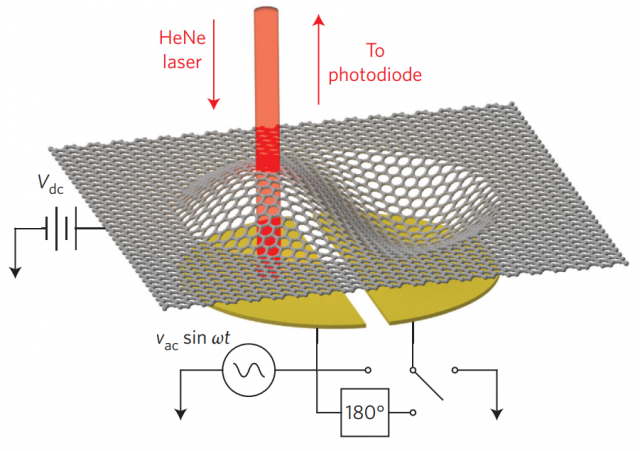
The use of Chladni figures in graphene nanodrums to control the quality of graphene sheets is not practical today, since wrinkles may appear during the fabrication of the nanodrum. However, graphene nanodrums can be used in other applications. Robert De Alba, Cornell University, New York, USA, and colleagues have studied the nonlinear phenomena in a circular graphene nanodrum using a monolayer graphene sheet suspended over a hole 2. The diameters range from 5 to 20 μm. The vibrational modes of the nanodrum are driven electrostatically by using two independent back-gates located 1.7 μm under the graphene monolayer. The mechanical motion was detected through optical interferometry by using a HeNe 633nm laser, focused to a spot of diameter ∼ 1μm.
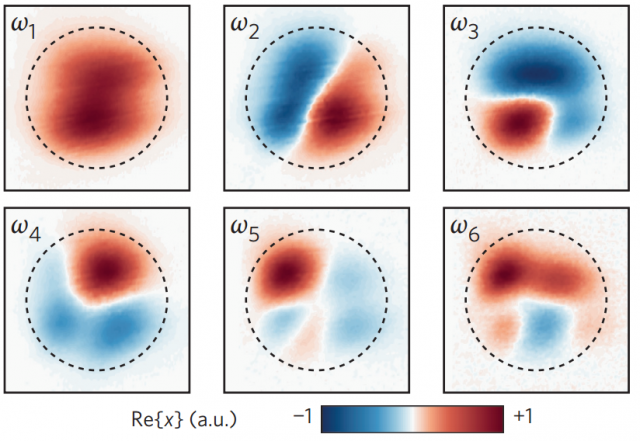
The shape of the first six mechanical modes of the circular, monolayer, graphene nanodrum are shown in Figure 4. The results obtained by De Alba et al. are very similar to those obtained by Davidovikj et al., in good agreement with numerical simulations. However, the focus of De Alba et al. is the nonlinear behaviour at cryogenic temperatures (T < 4 K). Concretely, frequency mixing, a nonlinear effect that takes into account three vibrational modes. The excitation of a central mode induces the transfer of energy between the fundamental mode and the highest mode, resulting in the amplification of the lattest. This amplification by frequency mixing has potential applications in information and communications technologies.
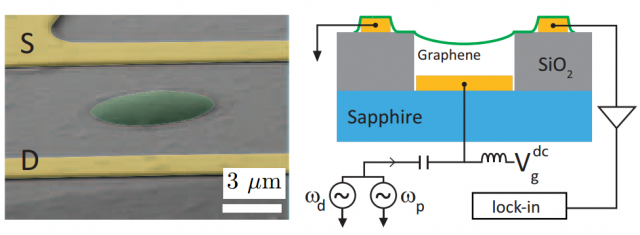
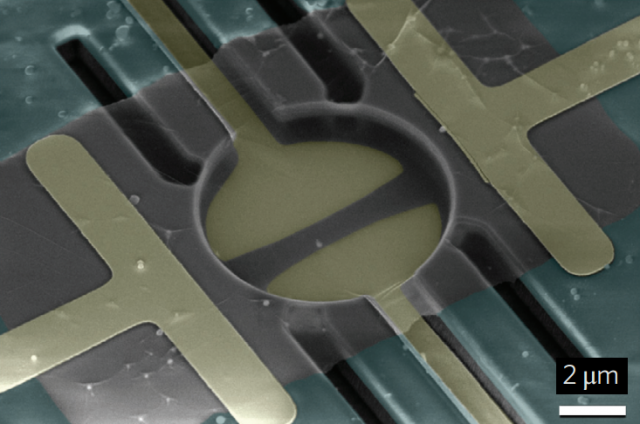
The nonlinear amplification of vibrational modes in monolayer graphene nanodrums is also the focus of John P. Mathew, Tata Institute of Fundamental Research, Mumbai, India, and colleagues 3. Figure 5 (left) shows a scanning electron microscope image of their graphene drum resonator. An all-electrical scheme is used for the actuation and detection of the mechanical modes. The graphene layer is between two Cr/Au electrodes (S and D in Figure 5, left). The circular nanodrum has a diameter of 3.5 µm, being suspended 300 nm above a local gate electrode of Ti/Pt (see Figure 5, right). This gate electrode serves the dual purpose of actuating the membrane’s motion as well as tuning the resonance frequencies of various modes. The nonlinear amplification by frequency mixing has been studied at 5 K in a cryostat.
The results of Mathew et al. are similar to those obtained by De Alba et al., hence I will omit the details. The reader may ask himself what they are useful for. At cryogenic temperatures the graphene nanodrum is expected to show quantum motion, acting as a phonon cavity. In such a case, it can be used as a testbed for quantum entanglement, squeezing, thermalization, and information exchange between modes near their ground state. Further research is required, but the graphene nanodrum solos promise a brilliant future in quantum information processing.
Chladni’s figures stimulated Michael Faraday to discover the phenomenon of electromagnetic induction 4. They also may be part of the inspiration of Erwin Schrödinger when he tries to understand the orbits of electrons in the theory of Niels Bohr by using a wave equation. None of them could imagine that graphene nanodrum solos could play the music of quantum mechanics.
References
- Dejan Davidovikj et al., “Visualizing the Motion of Graphene Nanodrums,” Nano Letters 16: 2768−2773 (08 Mar 2016), doi: 10.1021/acs.nanolett.6b00477; arXiv:1602.00135 [cond-mat.mes-hall]. ↩
- Robert De Alba et al., “Tunable phonon-cavity coupling in graphene membranes,” Nature Nanotechnology (13 Jun 2016), doi: 10.1038/nnano.2016.86; arXiv:1604.04605 [cond-mat.mes-hall]. ↩
- John P. Mathew et al., “Dynamical strong coupling and parametric amplification of mechanical modes of graphene drums,” Nature Nanotechnology (13 Jun 2016), doi: 10.1038/nnano.2016.94; arXiv:1607.00229 [cond-mat.mes-hall]. ↩
- L. Pearce Williams, “Faraday’s discovery of electromagnetic induction,” Contemporary Physics 5: 28-37 (1963), doi: 10.1080/00107516308205836. ↩
2 comments
[…] recomiendo leer mi última contribución “Graphene nanodrum solos,” Mapping Ignorance, 11 Aug 2016, sobre las vibraciones de hojas de grafeno suspendido que se comportan como tambores en la […]
[…] Una técnica parecida a la que usan los lutiers para comprobar la calidad de los instrumentos que fabrican puede emplearse para comprobar la calidad de las láminas de grafeno. Francisco R. Villatoro en Graphene nanodrum solos. […]