The wandering Venus southern polar vortex
Poles are truly interesting places for planetary scientists. On Earth, the southern pole and its low surface temperatures sustain a polar vortex, most famous for the related hole in the ozone layer. On Saturn, for example, both poles have astonishing structures, including a hexagonal wave in the northern hemisphere. Not surprisingly, Venus also has something to say about polar vortices, as shown by Itziar Garate-Lopez and some of our mutual work mates from the UPV/EHU Planetary Sciences Group in a paper recently published at Nature Geoscience 1.
Let’s start with a low-cost flight to Venus of the European Space Agency (ESA). Venus Express (VEX) was designed mostly as a replica of the preceding Mars Express mission, with some instrumentation shared with Roseta mission . ‘Express’ stands for the idea of having the shortest time possible from mission definition to launch. This implied just three years for Venus Express making it among the fastest missions in the history of space exploration when it was launched in November 2005 from Baikonur, Kazakhstan. One of the instruments onboard the spacecraft is the Visible and Infrared Thermal Imaging Spectrometer (VIRTIS), an imaging spectrograph in the visible and infrared wavelengths. This means VIRTIS has both spectral and spatial resolution, and makes it able to resolve the most important atmospheric features at several atmospheric levels. This is accomplished by observing the same structure at different wavelengths. In short, when you observer through what is usually termed an ‘atmospheric window’ then you are able to image deep structures in the atmosphere or even the surface. On the other hand, when you are recording data at wavelengths at which the atmosphere is opaque, then you are sounding just upper levels of the atmosphere. VIRTIS can deal with both situations and it can do it very efficiently.
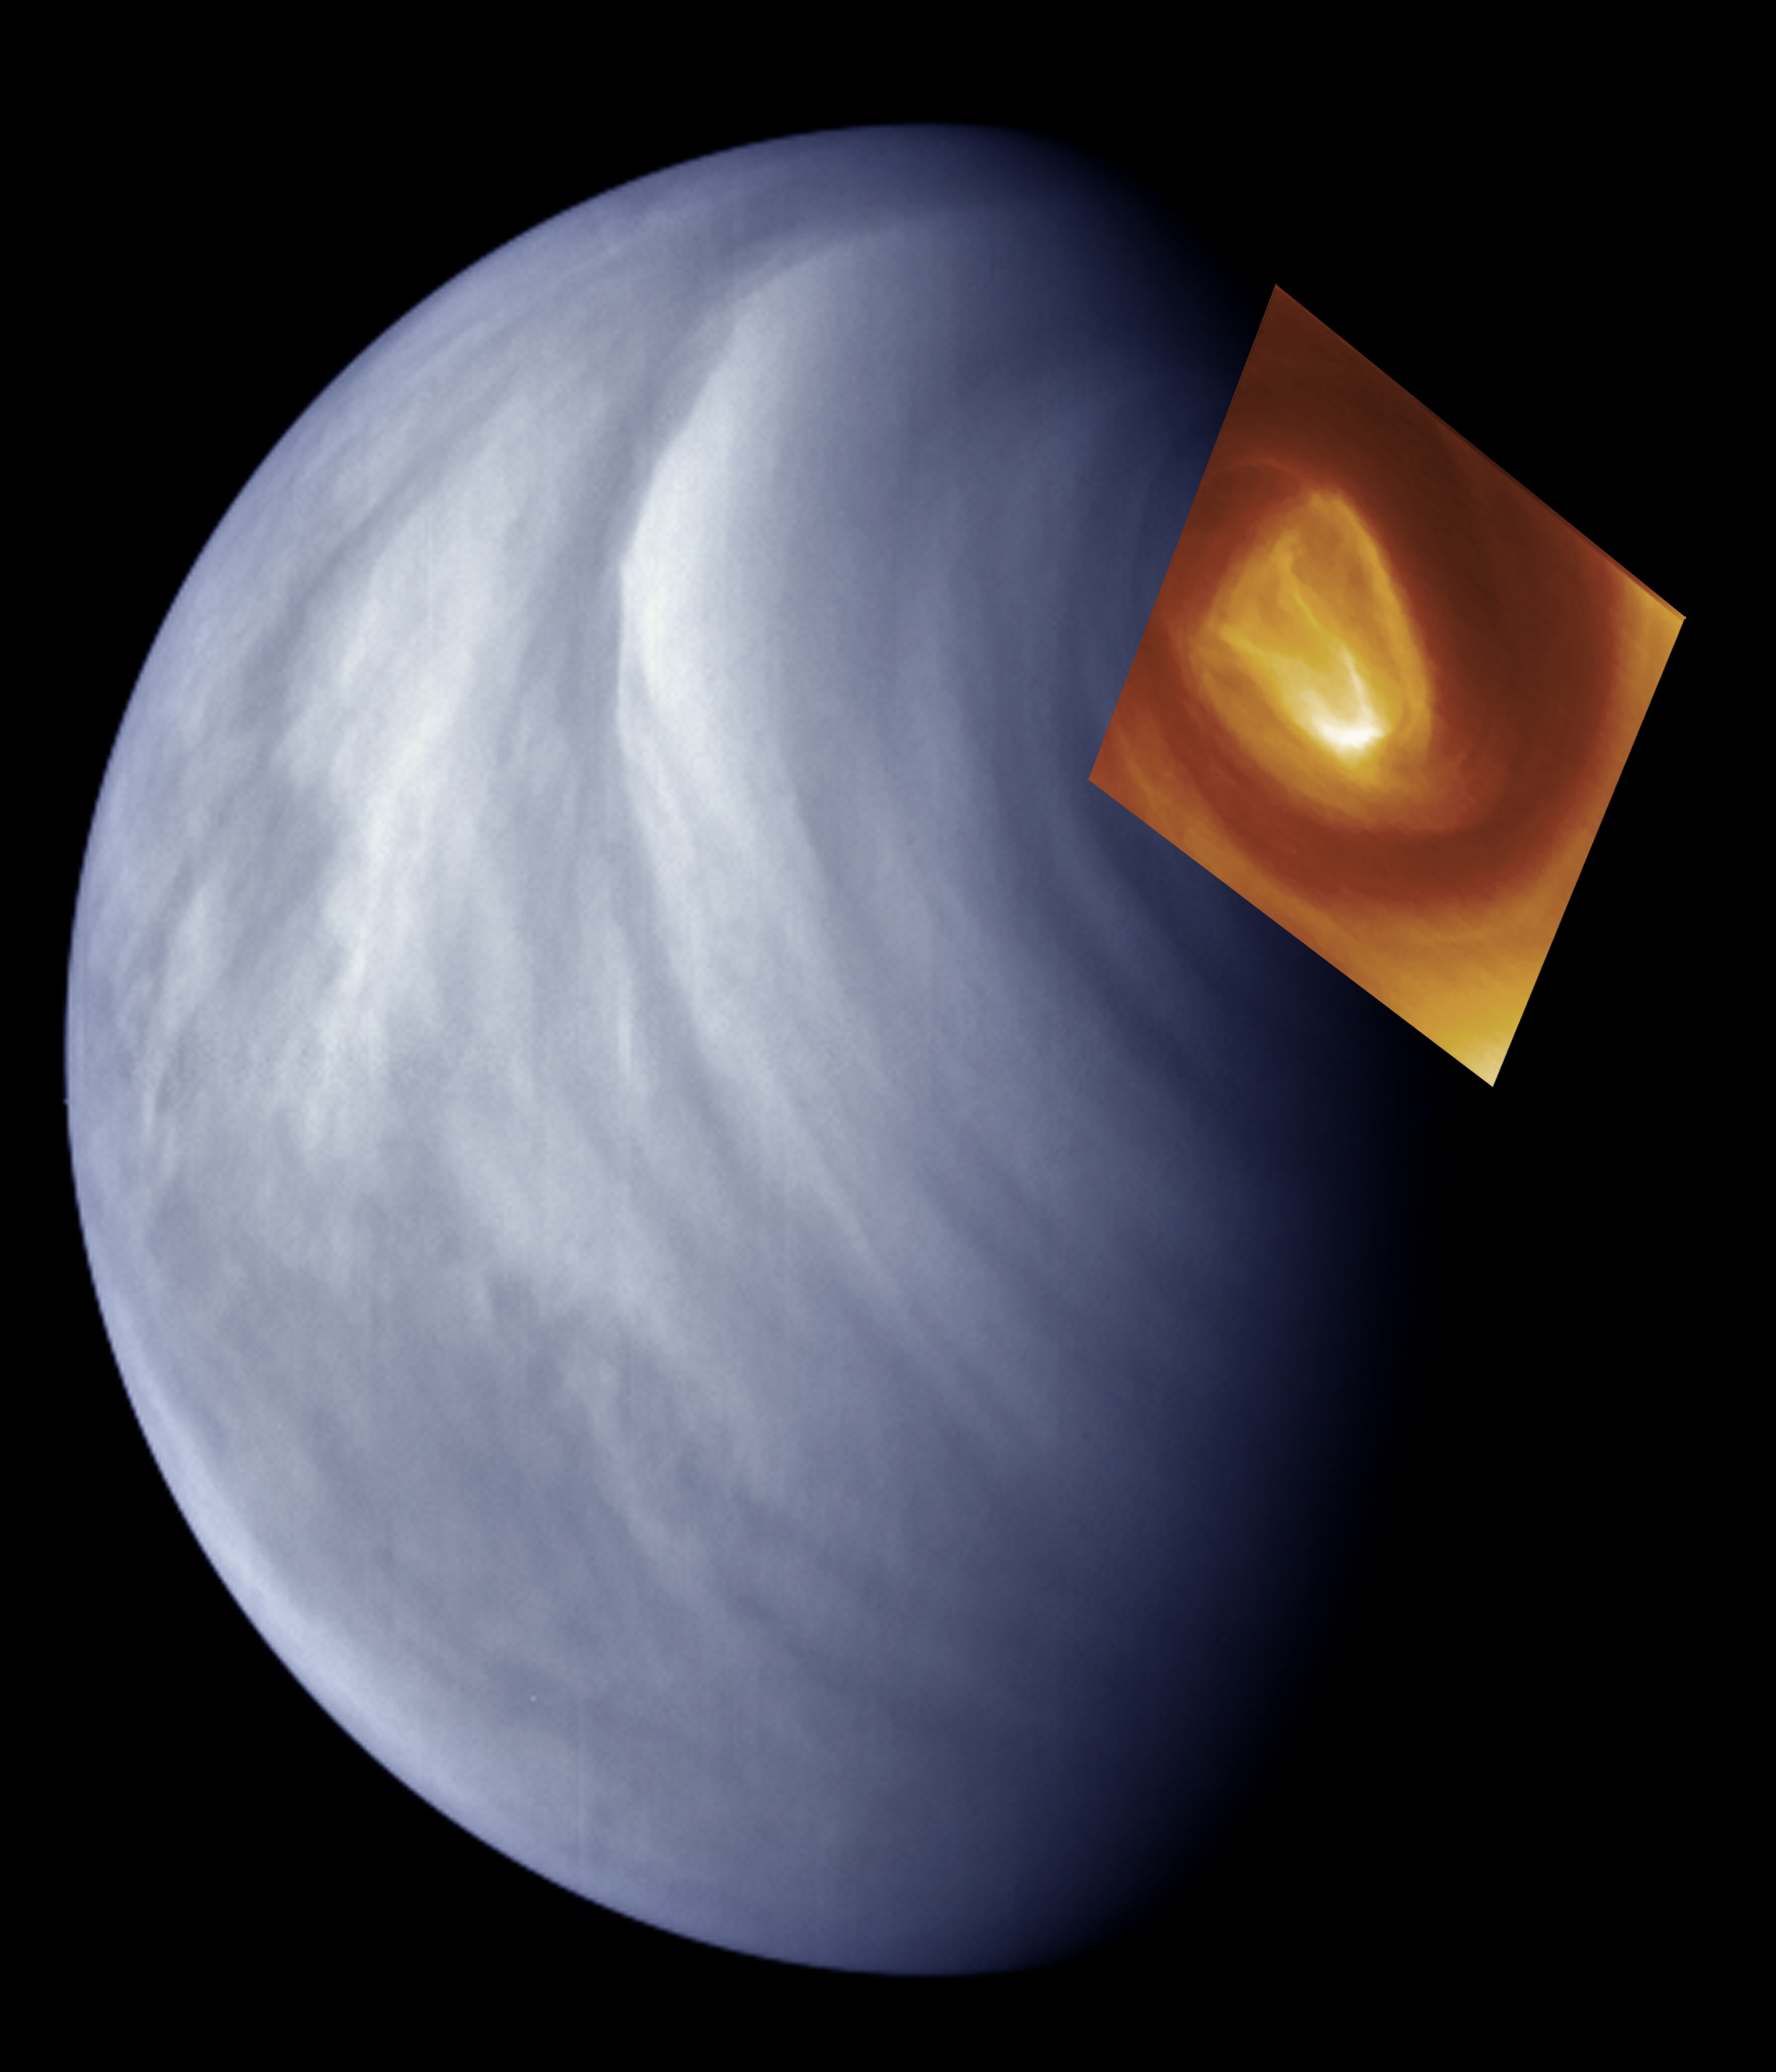
Today the mission is facing its end, expected by 2014, due to the harsh environment at Venus. And this is the time when most of the most interesting data come to the surface. Some notable features, of course, where found during the first few orbits 2 but most of the advances in science require a long, sustained effort to reveal the real nature of observed events. The southern vortex (sometimes termed the ‘dipole’), for example, was already discovered by the VEX mission [Ref. 2] and it was in fact quite similar to other vortex structure in Venus northern pole 3. But it was still required to have enough information to understand the nature and evolution of this atmospheric structure.
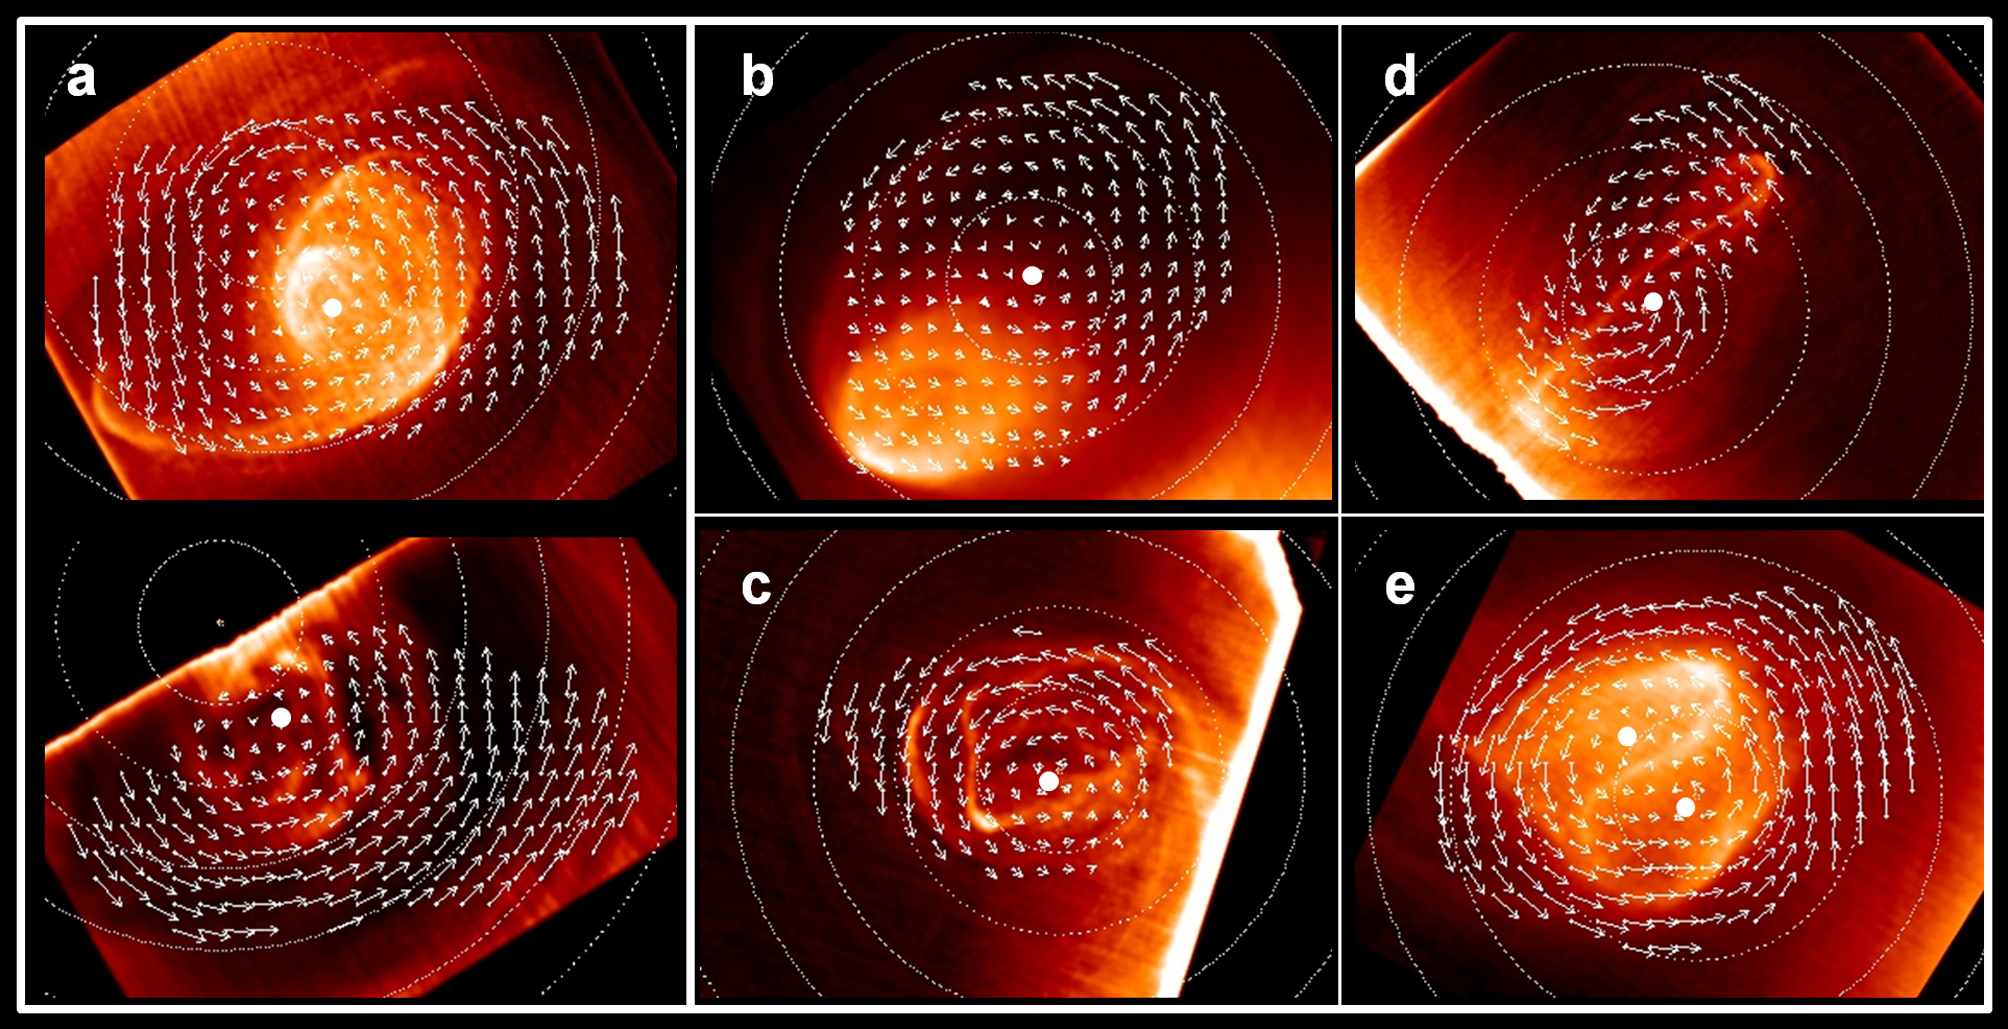
Garate-Lopez and collaborators analyzed images taken during more than 150 days (or orbits, since it takes about 24 h for the spacecraft to revolve around Venus). This resulted in almost 13,000 wind tracers. Each wind tracer implies being able to put a wind vector into a map of the atmosphere and so, only after a careful analysis of an impressive amount of data, planetary scientists are able to investigate the evolution of a dynamical feature like the southern polar vortex. More interestingly, the wind vectors retrieved by Garate-Lopez and collaborators are located at two different atmospheric levels. At 1.74 μm, we can see the deep thermal radiation filtered by cloud decks at around 40 km. Note that, in Earth’s atmosphere, this would be higher than the highest clouds. In Venus’ atmosphere, instead, this is the lower cloud deck we can find in its extended, thick atmosphere. On the other hand, when we observe the VIRTIS images at 3.8 μm or 5.1 μm, the atmosphere is optically thicker and we are sensitive just to the upper clouds at around 60 km.
Data gathering is an essential part of science, but not all of it. I guess that the authors expected to have a clear picture of the vortex when so many wind vectors (at two levels, not to forget) were available. Not at all. Once all processed data were on the desk, it became clear that the behavior of the vortex was nothing but umpredictable. ‘We knew that the south polar vortex of Venus was long-lived and highly variable in morphology. However, having such a chaotic dynamic that changes day-to-day, and still be a permanent element of the planet, without actually ever being destroyed, it is puzzling’, declares Garate-Lopez.
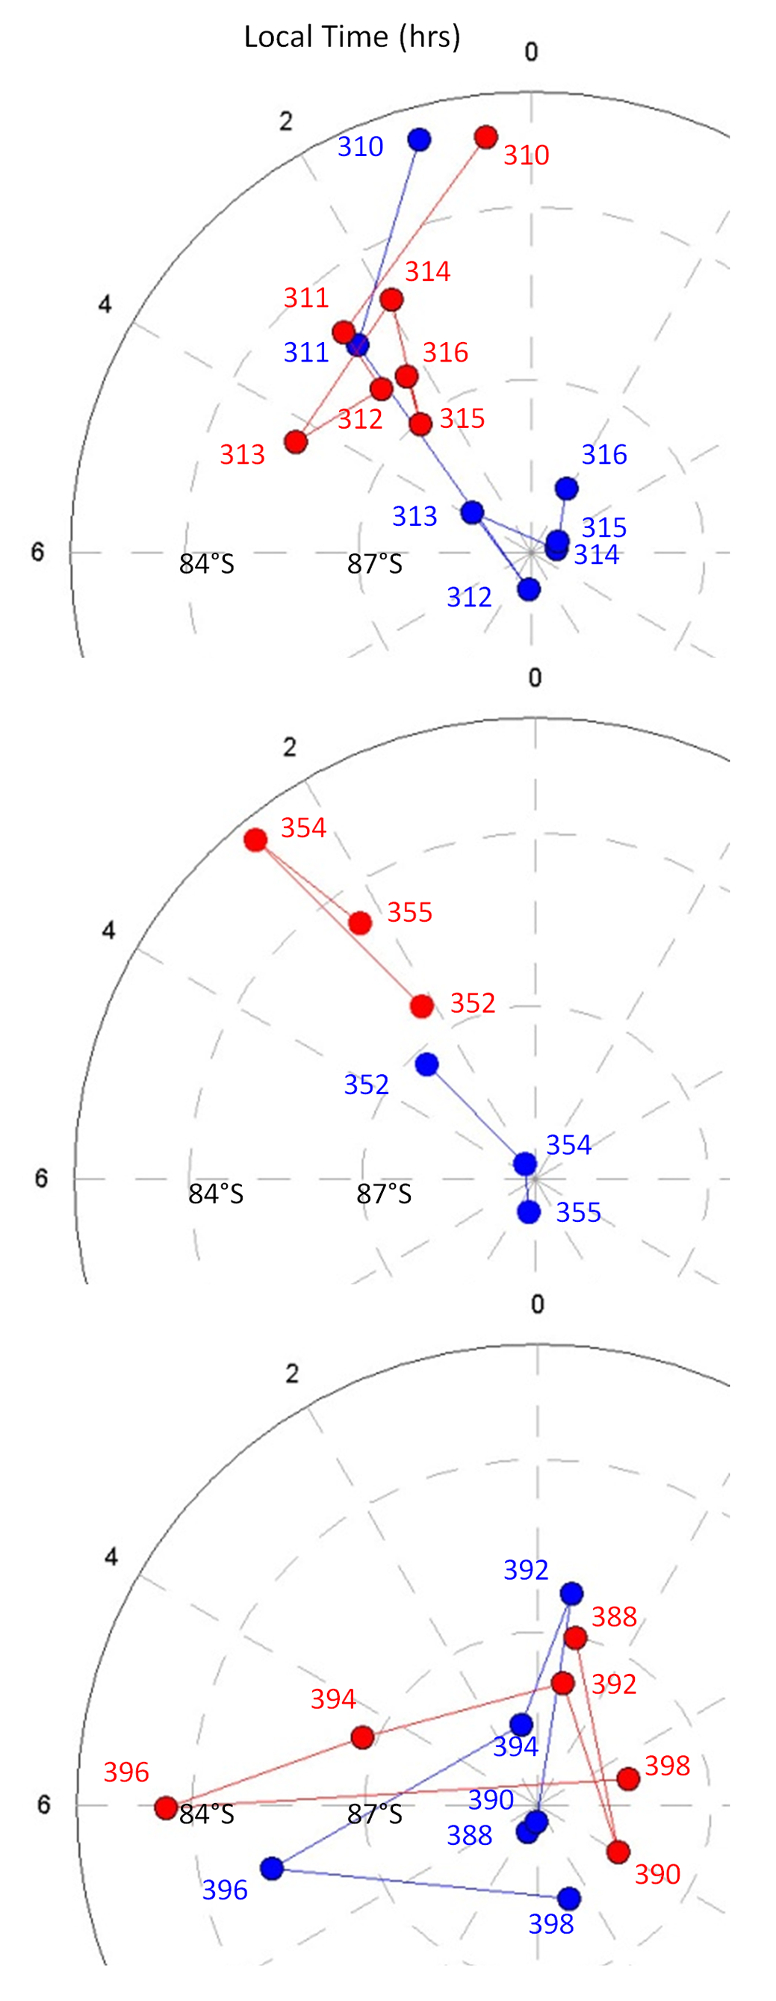
The path of footprints of the vortex at upper and bottom clouds is shown below. Not only the morphology of the structure was changing its face from day to day but also the movement of the vortex itself was following no understandable way in the atmosphere. ‘The small-scale structures inside the vortex are different at both altitude levels. Nevertheless the overall shape of the vortex is maintained, so we thought that it should move as a “firm tube” with the same trajectory in both vertical layers. To find out that this is not the case, and that it is more likely a “twisted tube” was unexpected’. Having wind vectors at two cloud levels as a function of time also allowed Garate-Lopez and collaborators to calculate what is usually called ‘vorticity’ maps, a measure of local rotation. No matter what aspect of the vortex they were looking at: it could be stable for tens of days or change in a few hours.
So now what?, might be the question. Venus atmosphere still hides a number of secrets. The Venus vortex is one of them but not possibly the most striking one. Any atmospheric scientist working on Venus will tell you that the ‘superrotation’ of the atmosphere is the most intriguing one. While Venus spins very slowly (a Venus day is longer than a Venus year), Venus upper atmosphere travels sixty times more rapidly, making in turn in about 4 Earth days. Is there any relation between all these challenging phenomena? I would bet there is. If we want to fully understand planetary atmospheres (not just Venus, but Earth’s one or any other planet’s atmosphere) we need to understand the mechanisms driving them. This will require further modelling of data, like the ones carefully retrieved in the work presented here. Data analysis is just a step, but it goes in the right direction.
References
- A chaotic long-lived vortex at the southern pole of Venus. Itziar Garate-Lopez, R. Hueso, A. Sánchez-Lavega, J. Peralta, G. Piccioni, P. Drossart (2013). Nature Geoscience. doi:10.1038/ngeo1764 ↩
- Piccioni, G. et al. South‐polar features on Venus similar to those near the north pole. Nature 450, 637‐40 (2007). d.o.i.: 10.1038/nature06209 ↩
- Suomi, V. E. & Limaye, S. S. Venus: further evidence of vortex circulation. Science 201, 1009‐1011 (1978). d.o.i: 10.1126/science.201.4360.1009 ↩
1 comment
[…] una década de trabajo para muchos equipos. La primera parte del trabajo de Itziar lo comenté en esta entrada de Mapping Ignorance, pero aquí me gustaría ampliar aquel comentario con todo lo que vino […]