An “Y” drawn on the clouds of Venus
An “Y” drawn on the clouds of Venus
Author:
Javier Peralta (Algeciras, Spain, 1979) holds a Degree in both Astrophysics and Applied Physics (Universidad de La Laguna, 2003), and a PhD in Physics (Universidad del País Vasco, 2009). He is specialized in the atmospheric dynamics of slowly rotating planets and has published 18 articles (8 as main author). He has worked in the analysis of data from different missions (Venus Express, Mars Express, Galileo), and starting April 2015 will get involved in the japanese mission to Venus “Akatsuki”.
Our solar system frequently seems a beauty competition where each planet proudly exhibits an attractive fingertip. Jupiter is a huge gaseous giant dressing with contrasted belts and zones and an ancient reddish spot. Saturn dances hula hoop with an impressive system of rings while loves to celebrate its birthdays triggering the biggest storms of the solar system. Mars sometimes becomes shy and covers its hypnotic surface with global dusty storms. Uranus glows in beautiful cyan and rotates with its pole directly facing to the Sun, while Neptune seems a peaceful blue world but with the strongest winds of the solar system. Venus is no an exception in this sense, and its apparently featureless atmosphere hides many secrets that are revealed when this planet is observed at wavelengths others than the visible range. For instance, in the1920s it was first reported that Venus clouds exhibited dark features at ultraviolet wavelengths 1, what also allowed to discover the strong westward winds encircling the planet every 4 days. Infrared, microwave and radio observations permitted us to see its surface and find out that Venus globe rotates drastically slower than the atmosphere (every 243 terrestrial days) and in the opposite sense of the other planets. Infrared sensing also revealed new cloudy structures and permanent quickly-changing vortices at both poles.
Nevertheless, none of Venus cloud features has acquired the mysterious and challenging character as the so called “Y” feature (also known as Ψ, reversed C or Y-tilted by 90º). Firstly identified in the beginning of the 1960s 2, it is only visible in ultraviolet images as a global-scale dark pattern with two arms symmetric relative to the equator and extending up to a latitude of 45º. Ground-based observers originally interpreted the Y feature as the result of the zonal advection of planetary-scale UV markings due to Venus’s superrotating atmosphere, although images taken during the Mariner 10 mission proved that the motion of the Y is inconsistent with the winds extracted by tracking small-scale features 3. Hence, researchers soon arrived at the conclusion that such a big structure propagating differently to the prevailing winds and maintaining its shape during days should definitely be an atmospheric wave. Identifying the nature of this wave soon became a crucial challenge since its huge size could be indicating an important role of the waves to explain why the Venus atmosphere rotates 60 times faster than the solid globe (the still unsolved problem of the atmospheric “superrotation”). Moreover, nobody knew yet the reason for the dark patterns visible in the UV images, and the dark Y-feature was the most prominent example. Also, nor its “Y” shape or its temporal evolution had received a satisfying explanation.

As a result of the collaboration between researchers from the Institute of Astrophysics of Andalucia and the Universities of the Basque Country and Lisbon, we have recently published in Geophysical Research Letters new valuable insights about the Y-feature, simultaneously explaining several of its unknowns 4. Considering its restricted location and propagation about the equator, the wave behind the Y-feature had been classically interpreted in terms of terrestrial analogues of equatorially-trapped waves, mainly as single Kelvin wave or its combination with a Rossby wave acting at midlatitudes. Nevertheless, we demonstrated in a previous work that these atmospheric waves −arising on fast rotating planets like the Earth or Mars− were not a natural solution from the different set of equations that describe the atmosphere of slowly rotating planets like Venus 5. For this reason, we have deduced from the Venus equations a new type of atmospheric wave that more accurately explains the characteristics of the Y-feature. This new wave propagates trapped not only about the equator but also about the altitude where the winds of Venus reach their maximum. Under the strong vertical variation of the Venus winds, the wave solution predicts a vertical confinement of no more than 8 km, which would explain why the Y-feature is only visible at the restricted altitude range sensed with UV images. Other properties are that the wave’s phase speed and its horizontal width depend on each other, that the disturbances affecting vertical wind speeds correlate with the region where the Y is dark, and that vertical perturbations are phase-shifted 180º relative to those affecting the horizontal wind. More importantly, the wave’s disturbance affecting the vertical velocity of the wind shoots up where the background wind has its maximum in the vertical direction, supporting previous hypotheses of dark contrasts being caused by the upwelling of an ultraviolet absorber present at a lower altitude.

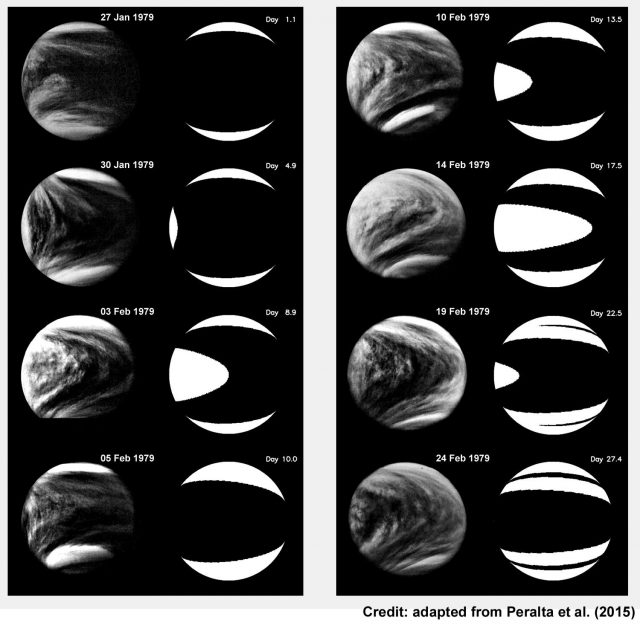
We also realized that the particular shape of “Y” can be explained as the result of the progressive distortion that this wave experiences when propagating under realistic conditions for Venus. Since the zonal winds on Venus are constant between the equator and mid-latitudes −clearly departing from a solid-body rotation− the period of rotation at high latitudes is shorter than at the equator, thus implying a distortion over the phase of the wave. This is clearly seen when comparing the wave evolution with UV observations of the Y-feature as reported during 30 days by the Pioneer Venus mission (see Figure 3). Moreover, the dark streaks observed during the Mariner 10 and Pioneer Venus missions can be also explained as the phase of the wave becoming stretched after encircling the planet several times. Provided that the model only includes the background westward winds, we are confident that the inclusion of the Venus meridional winds will result in more tilted dark streaks, thus allowing to obtain results even closer to the observations.
Discovering the real nature of the atmospheric wave behind the Y-feature −as well as deducing its mathematical expressions− is a crucial step towards characterizing its role in the energy balance and general circulation of the puzzling Venusian atmosphere. More importantly when its presence/absence seems to be related to the severe variations on Venus winds along the years, as reported by Pioneer Venus and more recently confirmed by ESA’s Venus Express observations. Of course, discovering that the “Y” shape can be explained as a persistent wind deformation of a new type of planetary-scale wave seems quite cool, although it still remains finding our the real source periodically exciting it. Similarly to a crime scene, the research is incomplete until you know the crime motivation.
References
- Ross, F.E., 1928: Photographs of Venus. Astrophysical Journal, 68, p.57. ↩
- Boyer C. and Camichel H., 1961: Observations Photographiques de la Planète Vénus. Annales d’Astrophysique, 24, p.531. ↩
- Belton, M.J.S., Smith, G.R., Schubert, G., and Del Genio, A.D., 1976. Cloud Patterns, Waves and Convection in the Venus Atmosphere. Journal of the Atmospheric Sciences, 33, 1394–1417. ↩
- Peralta J., M. A. López-Valverde, D. Luz & P. Machado (2015). Venus’s major cloud feature as an equatorially trapped wave distorted by the wind, Geophysical Research Letters, DOI: http://dx.doi.org/10.1002/2014gl062280 ↩
- Peralta, J., Imamura T., Read P.L., Luz D., Piccialli A. and López-Valverde M.A. (2014). Analytical solution for waves in planets with atmospheric superrotation. II. Lamb, Surface, and Centrifugal waves, The Astrophysical Journal Supplement Series, 213 (1), 18, 10.1088/0067-0049/213/1/18. ↩
4 comments
[…] ikuskizun ederra da. Horretaz hitz egiten digu planeta honetaz asko dakien Javier Peraltak An “Y” drawn on the clouds of Venus […]
[…] Venus puede que sea el aparentemente más soso de los planetas del Sistema Solar. Pero es solo cierto si lo observas en el visible; a otras longitudes de onda es todo un espectáculo. Nos lo cuenta de primera mano […]
[…] japonesas tenemos a nuestro antiguo compañero y siempre amigo Javier Peralta, un experto en la atmósfera de Venus que tras su tesis doctoral en el Grupo de Ciencias Planetarias UPV/EHU y estancias en el Instituto […]
[…] images reveal the cloud structure with its Y structure while thermal infrared images show high altitude clouds. There are dark “cracks” in the […]