Sesame Street and brain activity in children
Sesame Street and brain activity in children
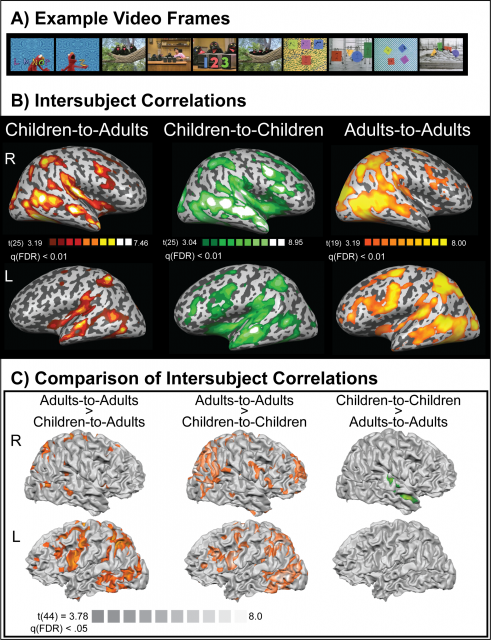
In the real world, children learn new information by participating in classrooms, interacting with their family and friends, and watching educational videos. While previous neuroimaging research has typically used simple tasks and short-lasting stimuli, in a new study 1 published in PloS Biology researchers examined brain development using a more complex and naturalistic educational stimulus. Children and adults all watched the same Sesame Street video as their neural activity was measured using functional magnetic resonance imaging (fMRI).
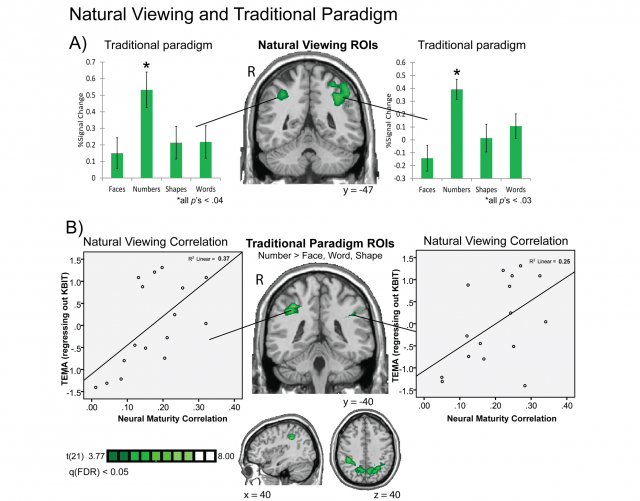
The scientists found that the degree to which children showed adult-like brain responses was correlated with their math and verbal knowledge levels. In the intraparietal sulcus, children’s neural correlation with adults depended on their mathematics knowledge whereas in Broca’s area, it depended on their verbal knowledge. Additional experiments showed that children’s neural responses in the intraparietal sulcus are selectively driven by numerical content both when children are watching Sesame Street and when they engage in a number matching task.
These results, eventually, could help understand the cause when a child experiences difficulties mastering school work. Instead of behavioral tests for trying to get the bottom of learning impairments, the use of new imaging studies provide a totally independent source of information about children’s learning based on what is actually happening in the brain.
For the investigation, 27 children between the ages of 4 and 11, and 20 adults watched the same 20-minute Sesame Street video. Like the regular program, the recording featured a variety of short clips focused on numbers, words, shapes, and other subjects. The children then took standardized IQ tests for math and verbal ability.
To capture the neural response to the show, the researchers turned to fMRI scans. Using magnetic fields, the scans virtually segment the brain into a three-dimensional grid of about 40,000 pixels, known as voxels, and measure the neural signal intensity in each of those tiny sectors. The study produced 609 scans of each participant, one every two seconds, as they watched Big Bird, the Count, Elmo and other stars of the educational series. Using statistical algorithms, the researchers then created “neural maps” of the thought processes for the children and the adults and compared the groups.

Children whose neural maps more closely resembled the neural maps of adults scored higher on standardized math and verbal tests. In other words, the brain’s neural structure, like other parts of the body, develops along predictable pathways as we mature.
The study also confirmed where in the brain these developing abilities are located. For verbal tasks, adult-like neural patterns in the Broca area, which is involved in speech and language, predicted higher verbal test scores in children. For math, better scores were linked to more mature patterns in the intraparietal sulcus (IPS), a region of the brain known to be involved in the processing of numbers.

In addition to showing a mathematics-related temporal pattern in the IPS, children’s IPS responses during the numerical segments of the Sesame Street video were also higher in amplitude than during the non-numerical video segments. Together these findings would demonstrate content-based neural responses during natural viewing of educational videos in children.
Using normal activities, like TV watching, may provide a more accurate indicator of children’s learning and brain development in the real world than the short and simple tasks typical of fMRI studies, the authors argue. Like the Sesame Street video, learning environments in schools are rich in complexity along with the academic lessons, write the authors.
To test that assumption, the researchers had the children perform traditional fMRI tasks by matching simple pictures of faces, numbers, words, or shapes. During these more limited activities with simple images, the neural responses of the children did not predict their test scores, unlike the more naturalistic task of watching Sesame Street.

Although the study does not advocate TV watching, it does show that neural patterns during an everyday activity like watching television are related to a person’s intellectual maturity.
When you put a child in front of an educational TV program it is not true that nothing is happening–that the brain just sort of zones out. Instead, what we see is that the patterns of neural activity that children are showing are meaningful and related to their intellectual abilities. For the best…and maybe for the worst.
References
- Cantlon JF, Li R (2013) Neural Activity during Natural Viewing of Sesame Street Statistically Predicts Test Scores in Early Childhood. PLoS Biol 11(1): e1001462. doi:10.1371/journal.pbio.1001462 ↩
1 comment
It’s an amazing post in support of all the online
people; they will get benefit from it I am sure.