Economics and the debate on nature vs. nurture
Economics and the debate on nature vs. nurture
This article summarizes a review of the literature presented in Sacerdote (2011) 1. I thank Ricardo Mora for bringing it to my attention.
The simplest model of behavioral genetics assumes that child outcomes (Y) are produced by a linear and additive combination of genetic inputs (G), shared environment (F) and unexplained factors (S). For instance, if Y is years of education, the model can be expressed as
Y = G + F + S,
where G, F and S are the number of years of education explained by genetic factors, environment and non explained, respectively.
Many studies would be necessary to show exactly which genetic and environmental factors are behind this relation. While this is done, we can learn a great deal about the importance of the three factors. If in addition we assume that G, F and S are uncorrelated, and take the variance on both sides of the equation we get:
Var(Y) = Var(G) + Var(F) + Var(S),
Dividing both sides by Var(Y) gives:
1 = g + f + s,
where g are f are the part of the variance in years of study explained by genetic and environmental factors, respectively, while s is the variance that remains unexplained.
Now, if we measure Y, G, F and S in the appropriate units (substract the mean and divide by the variance), standard statistics show that the correlation in outcomes between two adoptive siblings equals:
Corr(Y1,Y2) = Covar(Y1,Y2) = Cov(F1,F2) = Var(F1) = f,
while the correlation between two non-adoptive siblings equals
Corr(Y1,Y2) = Cov(Y1,Y2) = Cov(G1+F1, 1/2G1+F1) = 1/2g + f.
All this assumes that adoptive siblings share no genetic factors but share the same environment, while non-adoptive siblings share half of the genetic factors and the same environment.
By studying correlations between adoptive and non-adoptive siblings we can find the values for g, f and s. For instance, if the correlations are 0.1 and 0.35, respectively, we have that f = 0.1 and g = 0.5. If this is the case we say that the genetic factor explains 50% of the differences in Y in a population, while the environmental factor explains just 10%, leaving an unexplained 40%. A similar analysis can be done for fraternal and identical twins.
There are four meta-studies on the literature that measures the contributions of genes and family environment to IQ: Goldberger (1977) 2, Bouchard and McGue (1981) 3, Devlin et al. (1994) 4 and Taylor (1980) 5. The variance attributed to genetic factors ranges between 32% and 60% (with the average around 50%), while the common environment explains anything between 4% and 29% (averaging 15%). Four studies, conducted mainly by sociologists and economists, use the behavioral genetics model to analyze the variance in years of education: Behrman and Taubman (1989) 6, Scarr and Weinberg (1994) 7, Teasdale and Owen (1984) 8 and Behrman et al. (1977) 9. The genetic factors explain between 36% and 88% (average around 60%) of the variance, while the common environment explains between 5% and 41% (average around 20%). Studies on earnings and personality traits show similar differences between genetic and environmental explanations, although at a lower level.
These findings are, however, at odds with the fact that the environment seems to matter, as found in the studies of the effects of school assignment made by Hoxby and Murarka (2007) 10, Evans and Schwab (1995) 11 and Neal (1997) 12. One could try to reconcile these data with the above model in different ways: may be the effect is working through the 15-20% role of the environment or may be the behavioral geneticists are working within a restricted range of environments observed in a few societies. Also, the underlying model may be excessively simple. The influence of the different factors may not be additive or linear, or maybe correlations among them are not zero, and not taking into account these possibilities perhaps underestimates the environmental factor or overestimates the genetic one. In fact Dickens and Flynn (2001) 13 present a model in which environment responds endogenously to genetic endowments and finds different estimates. Björklund et al. (2005) 14 allow for different shared environment correlations among identical twins relative to fraternal twins and shows that the heritability effect falls significantly. Ridley (2003) 15 and Turkheimer et al. (2003) 16 also show how nonlinearities indeed may cause the model to overstate the genetic factor.
There is a long way to go from the observation that genetics matter to the variance decomposition, the causal effects for interventions outside the range, and to make predictions about policy changes. A sight problem may have a 100% genetic component but glasses can be useful.
Sacerdote (2011) [1] proposes a different approach, used by economists, that requires calculating transmission coefficients of various outcomes from adoptive and biological parents to adoptees. An example of transmission coefficient takes the form:
Ei = a + dEMi + gXi + ei,
where Ei and EMi are adoptive child’s and adoptive (or biological) mother’s education respectively and Xi could be a vector of controls for child gender or age. Coefficient d captures the degree to which additional years of education for the mother are transmitted to the child.
Björklund et al. (2006) 17 uses the census of all Swedish adoptees who were born during 1962-1966 and a 20% sample of non-adoptees born during the same time period, and estimates transmission coefficients from adoptive and biological parents to adoptees and non-adoptees. The outcomes considered are years of schooling, completion of university education, annual earnings, and annual income.
For the non-adoptees we see transmission coefficients of earnings in the range of 0.24, similar to other estimations one finds in the literature. The transmission for education is also 0.24 and is also similar to those found in other studies. No difference is found between using the father’s education or the mother’s.
For adoptees there are some remarkable facts. Transmission of years of schooling from biological fathers to adoptees is strong and has a coefficient of 0.113, almost exactly the same as the transmission from adoptive fathers to adoptees, which is 0.114. Furthermore, the two transmissions add up to 0.227, which is roughly equal to the 0.24 transmission coefficient for the non-adoptees. Sacerdote (2007) 18, Liu and Zeng (2007) 19 and Plug (2004) 20 provide additional studies along this line. This apparent additivity of the transmission from biological and nurturing parents can be observed in five of the six relations analyzed. The transmission coefficient for biological parents is, however, bigger for some of the relations.
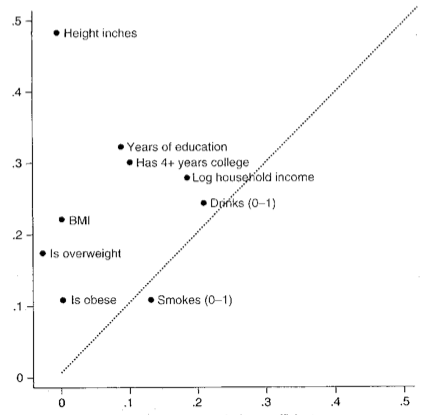
Figure 1 graphs transmission coefficients for 9 different outcomes for adoptees and non-adoptees in Liu and Zeng (2007) [19]. The vertical axis is for the transmission coefficient for non-adoptees and the horizontal axis is used for the transmission coefficient for the adoptees. The pattern one notices is that physical outcomes like obesity and height show very little transmission to adoptees, while social outcomes like moderate drinking or smoking show an almost equal transmission from biological and nurturing parents. Education is somewhere in between.
Studies like this may reconcile the mounting evidence that biology matters a lot with the no lesser evidence that differences in school quality and home environment are also important, and may also provide the basis for effective policies towards social inequalities.
References
- Sacerdote, Bruce. 2011. Nature and nurture effects on children’s outcomes: what have we learned from studies of twins and adoptees? Handbook of Social Economics 1A, Elsevier ↩
- Goldberger, Arthur S. 1978. The genetic determination of income: comment. American Economic Review 98, 960-69. ↩
- Bouchard, T.J., and McGue, M. 1981. Familial studies of intelligence: a review. Science 212, 1055-1059 ↩
- Devlin, B.; Daniels, M., and Roeder, K. 1997. The heritability of IQ. Nature 388, 468-471. ↩
- Taylor, Howard F. 1980. The IQ game, New Brunswick: Rutgers University Press. ↩
- Behrman, Jere R., and Taubman, Paul. 1989. Is schooling ‘mostly in the genes’? Nature nurture decomposition using data on relatives. Journal of Political Economy 97, 1425-1446. ↩
- Scarr, Sandra, and Weinberg, Richard A. 1994. Educational and occupational achievements of brothers and sisters in adoptive and biologically related families. Behavior Genetics 24, 301-325. ↩
- Teasdale T.W., and Owen, David R. 1984. Heredity and familial environment in intelligence and educational level—A sibling study. Nature 309, 620-622. ↩
- Behrman, Jere R.; Taubman, Paul, and Wales, T. 1977. Controlling for and measuring the effects of genetics and family environment in equations for schooling and labor market success. In Kinometrics: Determinants of socioeconomic success within and between families, editor, Paul Taubman, Amsterdam; New York: North-Holland Pub. Co. Elsevier North-Holland. ↩
- Hoxby, Caroline M., and Murarka, Sonali. 2007. New York City’s charter schools overall report. Cambridge, MA: New York City Charter Schools Evaluation Project, June. ↩
- Evans, William N. and Robert M Schwab. 1995. Finishing high school and starting college: do catholic schools make a difference? The Quarterly Journal of Economics 110, 941-974. ↩
- Neal, Derek. 1997. The effects of catholic secondary schooling on educational attainment. Journal of Labor Economics 15, 98-123. ↩
- Dickens, William, and Flynn, James R. 2001. Heritability estimates versus large environmental effects: the IQ paradox resolved. Psychological Review 108, 346-369. ↩
- Björklund, Anders; Jäntti, Markus, and Solon, Gary. 2005. Influences of nature and nurture on earnings variation: a report on a study of various sibling types in Sweden. In Samuel Bowles, Herbert Gintis, and Melissa Osborne Groves (eds.), Unequal chances: family background and economic success, pp. 145-164, Princeton: Princeton University Press. ↩
- Ridley, Matt. 2003. Nature via nurture, New York: Harper Collins. ↩
- Turkheimer, Eric; Haley, Andreana; Waldron, Mary; D’Onofrio, Brian, and Gottesman, Irving I. 2003. Socioeconomic status modifies heritability of IQ in young children. Psychological Science 14, 623-628. ↩
- Björklund, Anders; Lindahl, Mikael, and Plug, Erik. 2006. Intergenerational effects in Sweden: what can we learn from adoption data? The Quarterly Journal of Economics, forthcoming. ↩
- Sacerdote, Bruce I. 2007. How large are the effects from changes in family environment? A study of Korean American adoptees. The Quarterly Journal of Economics 121, 119-158. ↩
- Liu, Haoming and Zeng, Jinli. 2009. Genetic ability and intergenerational earnings mobility. Journal of Population Economics 22, 75-95. ↩
- Plug, Erik. 2004. Estimating the effect of mother’s schooling on children’s schooling using a sample of adoptees. American Economic Review 94, 358-368. ↩