How everyday astrophysics is done
How everyday astrophysics is done
After all those big discoveries of the latest years (LIGO’s gravitational waves, or NASA’s TRAPPIST system, for example) I felt the need to explain how normal everyday astrophysics is dealt with. To explain the little things behind any discovery, and the scientific journey between seeing something odd in the sky and explaining it with science. A thing that, I must say, is one of the best experiences I have ever had in my life as an astrophysicist during my stay in Jaén University working with a high energy galactic sources research group. I’m going to tell the story of TYC 3683-985-1, a remarkable star. For short I will use “the object” or “the star”.
It all begun in one of those long long nights at the observatory. We were tracking a number of objects in the sky every night, to see subtle brightness changes in four filters, infrared blue green and red, hoping to see something unusual. Those objects were close to X rays and gamma rays sources (whose locations are publicly accessible from a number of space telescopes websites), usually linked with black hole or neutron star related phenomena. We were looking for high energy sources in our galactic vicinity, principally microquasars. A microquasar is a medium size black hole entangled in orbit with a star. If they both get too close part of the star will be “sucked” to the black hole, forming an accretion disc around the black hole. In this scenario matter is so highly accelerated in the vicinity of the black hole that starts heating and ripping itself, forming a charged plasma of electrons, protons and all sort of particles. Those electrons may be ejected from the system at close to light speeds, emitting X rays in the process. If this happens in a supermassive black hole we call it a quasar. If this happens in a black hole-star binary system, with medium sized objects, it’s a microquasar. Those are very rare and understanding them can be really helpful for both galactic formation theories, star formation theories and also gravitational theories themselves. And they have a clear signature in the form of brightness dips as the system spins and the star eclipses the black hole or vice versa. So looking for variable stars near or in top of gamma ray sources were our starting point.
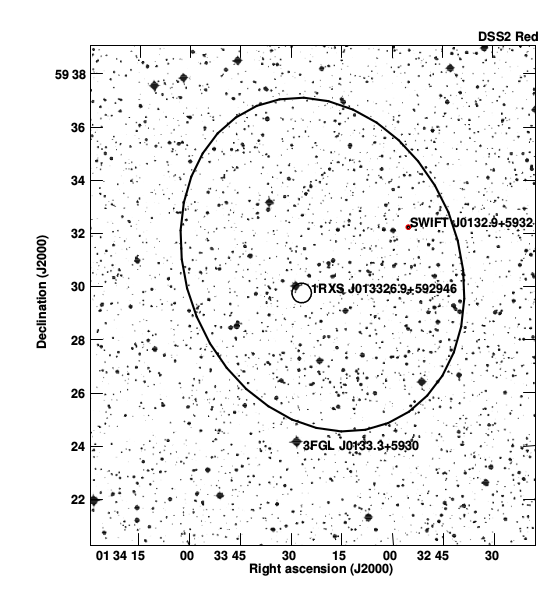
And we saw something odd 1. We detected an object with a periodic brightness dip of 70 days. It all came up after several months of observations. That was odd. The dip itself was big enough to consider that something is in the way of the star and us, but the shape of the curve of light as time goes by simply didn’t made any sense. It was all flat and then suddently sharply decreased, and sharply increased. There was no easy model to explain that particular light curve. Comparing the light flux in several wavelengths one can deduce a lot about a star. Our object was thought to be a Be star, thats a B-type star with some kind of envelope of hot gases that would make the infrared light intensity slightly rise above an usual B star. To understand the nature of the object we needed to asses the possibility of an envelope of that kind. If a compact object (say, a black hole or a neutron star) travels trough that envelope some of the gases will be accreted and X rays and gamma rays will be emitted as explained before, explaining those sources seen just near our object.
To measure this one has to “correct” the light that the telescope sees, as it is being modified by the galactic medium. Just as the atmosphere makes the sun more red than it really is, the galactic clouds of gasses (mainly hydrogen) makes things more red than they should be. Astronomers have maps of those clouds and, by knowing the position of a particular star in the galaxy one can estimate the amount of hydrogen that the light crosses from that point to us, so you can correct the light fluxes. This is a process called de-redening. Once it is done you can plot the average amount of light that the star emits in the frequencies that you are measuring. Remember, filters red green blue and infrared, and compare their corrected values to the expected ones from a normal B star. If there is some infrared excess, then you can assume that the star has a hot gas envelope. And that is a key element in making it shine in gamma rays if there is a compact object nearby. We did that and yes, the star had this kind of envelope. Wow. But something did not fit. The period. 70-ish days. This implies that the objects are not that close. The faster the period of the dips, the faster they eclipse each other, and the closer and faster they spin each other. If a black hole is submerged in the envelope of the star it has to be really nearby, and the 70 day period invalidates that. It all changed one night…

We decided to take some fast photometry. This is taking images separated only by minutes for a period of some hours of the same object. Usually we took only one image (in the four filters) per day or two, more or less at the same time each day or two, when weather allowed. We saw something that left us with no words: in 4 hours the star changed its brightness the same amount it did in 70 days. That did not made any sense! How was that possible? We spent that entire weekend measuring the star every 5 minutes and found out that we were all wrong about the period. The star had a period of 1.94 days and not 70! We thought that because we measured the star every day or two at the same time. This implied that every two days, if we measured it at the same time, we would be 0.08 periods ahead of the phase measured two days earlier, because the star made almost a full brightness cycle. Because the real period was really close to two days, if you measure it at the same time every day, you will get a really long period, sampling in our case 0.08 periods ahead every two days. What a sampling problem. Never measure things always at the same time. Since then we started long fast observation runs of the star, forming a really precise light curve with a very short period. And with the period and the estimation of the distances between the eclipsing objects you can compute the masses of the overall binary system. And it allowed a black hole in some of the scenarios. We were excited! But then a long road lied after us to identify the true nature of the object…

The spectra. It was all about the spectra. This is, the intensities of light frequencies, not just in four filters but in every frequency. And with good frequency resolution. It turns out that if a black hole is sucking the hydrogen from the envelope of a star, this hydrogen will shine with a very particular frequency. And if this hydrogen is spinning really fast one can assume that one side of the hydrogen disc around the black hole is going towards us and the other away from us, generating a Doppler effect. The frequencies seen there would be two peaks of similar intensity very close to the hydrogen main frequency, one slightly above and the other slightly below due to the Doppler effect. If this is not seen, then there is no accretion disc. So we asked this data to the observatory in Canary Islands and after some failed nights (due to bad weather) we got our result, and no such evidence was found… no accretion… what a turnover.
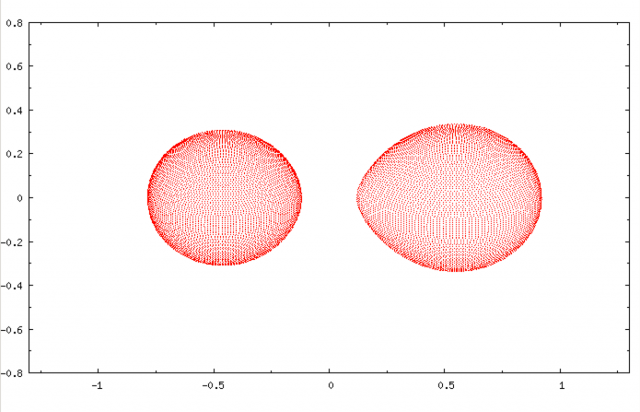
Also, a member of the group was reworking the X-ray data that overlapped with our star. This data was taken with the Swift space telescope, as a part of a number of surveys that the team behind it does, then making them public. He found out, applying a very complex analysis, that the centroid of the source did not overlapped exactly with our star… That were bad news, our star was not the source of the X-rays emissions. Our star wasn’t the source of that high energy flux and there were no accretion over there, so no compact object in sight, no black hole or neutron star in sight. The only explanation left was a very close binary system with some kind of hot gas envelope, two stars with very similar sizes so close that they “touch” each other as they spin around each other, generating the odd light curve this way. A far more common object, and not so interesting (a microquasar would be enough for a Nature journal paper). But well, that is how science works. There is a star modelling software, POHEBE, that allows you to model binary system and reproduce the light curves that you would see with your telescope. Using this software we concluded that the object was a contact binary. Two medium sized stars so close orbiting each others that they are deformed and maybe touching at some point.
That was not the big discovery we hoped for, but the journey was a big experience for me. It is like putting together a puzzle. Or being a detective. You start with very little information and you must link all the dots and make up some hypothesis that somehow explains all that you observe. It is a hide and seek game, where the reality tricks you into a direction and then you find yourself on a dead end, and need to take a different approach, change your mind, and try something new. And after a lot of work, then, finally, you come up with the answer: a contact binary. Very close visually to a gamma and X-ray source, probably from a galactic nucleus in the background that nature put there to play with us, poor astronomers, in Earth.
References
- Josep Martí, Pedro L. Luque-Escamilla, Josep M. Paredes, Kazushi Iwasawa, Daniel Galindo, Marc Ribó and Víctor Marín-Felip (2017) Peculiar objects towards 3FGL J0133.3+5930: an eclipsing Be star and an active galactic nucleus A&A doi: 10.1051/0004-6361/201628863 ↩