Winds of change in Saturn
Let’s admit it from the very beginning: Saturn is my favorite planet, I’m certainly biased when I speak of its wondrous atmospheric activity. In my defense I must ask for any rival to its giant periodic storms, polygon-shaped flows or seasonal changes. At the telescope, Jupiter may look funnier but, in the long-term, Saturn always catch your attention. More than a decade ago, the analysis of the structure of Saturn’s amazing Equatorial jet was part of my Ph.D. Thesis and now, half a Saturnian year later, we are back to find surprises in a recent publication 1.
This started in 2003. After relentlessly measuring wind vectors for a decade of Hubble Space Telescope images, professor Agustin Sanchez-Lavega had found an unbelievable drop in the Equatorial jet of the ringed planet 2. During the Voyager flybys, at the beginning of the 80s, Saturn had almost supersonic winds blowing at 1,600 km/h from West to East. A gale that apparently eased in the following years and, at the end of the 90s, it was about at half speed. Shortly after, NASA’s Cassini spacecraft was inserted in Saturn’s orbit and was able to study, among many other things, the winds at low latitudes 3. Cassini was powerfully equipped with filters able to sound at different atmospheric levels, showing that there was an intense vertical wind shear with slower winds at the top and faster winds a hundred kilometers below. They were not as fast as Voyager winds but they were getting closer. Was it just a matter of cloud features at different altitudes at various epochs or was there any real change in the flow? When we quantified the altitudes of cloud features for each mission (Voyager, HST, Cassini), we found that a real change in wind speeds was required to reconcile all data [4]. A loss of 100 m/s for the upper troposphere seemed to work well. Still, there was no known mechanism to produce such injection of momentum against the uncontainable inertia of the atmosphere. Ring-shadowing and the giant storms were accused but proofs (in the form of numerical models) were inconclusive.
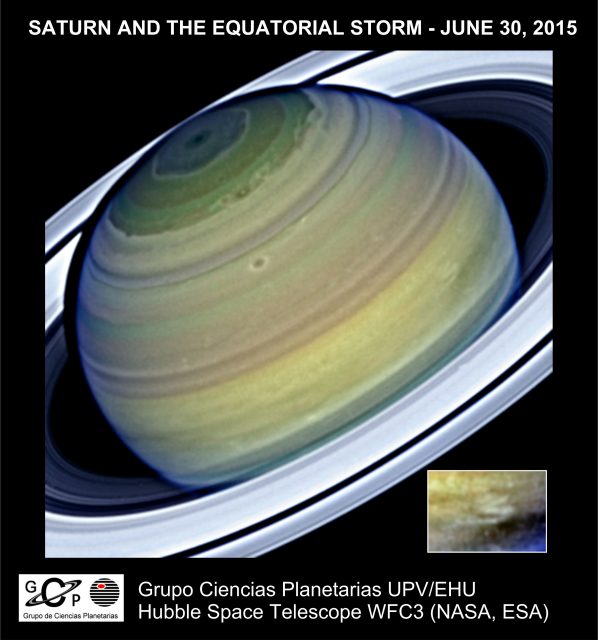
Serendipity came into action on June, 2015. A small telescope (just 11” in diameter) spotted a small bright feature in the usually dull Equatorial atmosphere. It moved fast, apparently at Voyager speeds. It was also caught by Hubble Space Telescope images taken to study a polar disturbance during the director’s discretionary time. Confirmed: it was really fast. Using the filter selection of HST, we were also able for the first time to measure features moving not just at two but at three altitude levels, progressively resembling the fast winds measured during the flyby of the Voyagers. At depths of 150 km into the atmosphere, wind speeds were indistinguishable.
![Figure 2. A comparison of the wind speeds in the Equatorial region at two different altitude levels [1]. The White Spot is the same feature shown in Figure 1. Credit: GCP-UPV/EHU.](https://mappingignorance.org/app/uploads/2016/11/Figura-2-NP-640x307.jpg)
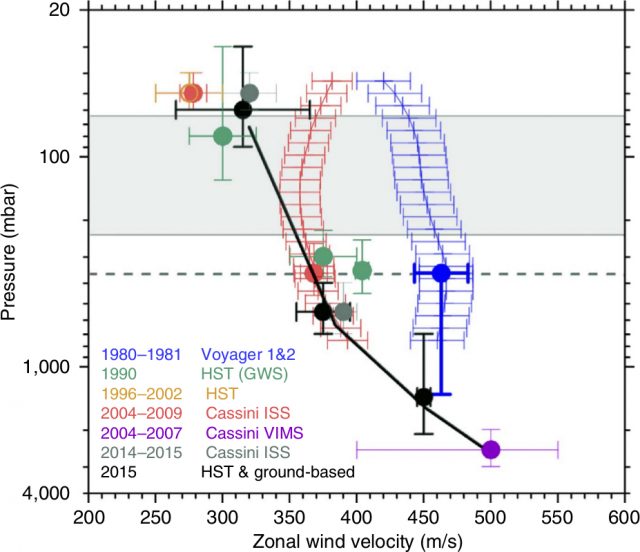
Now we have a bunch of data taken in the last thirty years that provide wind speeds differing in about a factor of two. What if we try to put these in a vertical axis? Results are displayed in Figure 3. We can appreciate that the vertical levels covered from different epochs and missions are substantially different. This is not only because of instrumental effects but also because of real changes in the distribution of clouds in the region, most likely due to the Great White Storm that disturbed the Equator in 1990. From this plot, everything seems to be consistent except the Voyager data. It was difficult to assess the altitude of cloud features moving in Voyager images 4, but cloud tops for some features reached much higher than expected levels. Were they moving at the actual speed of that level? Or were they drag by the deeper flow?
In science, the best way to break a block is to look for different techniques. For atmospheres under geostrophic equilibrium (for which the Coriolis force and horizontal pressure force are similar), it is possible to infer the vertical wind shear from the meridional gradients of the temperature. This is known as the thermal wind equation and allows to integrate upwards from a reference wind using only temperature data. The small print is that common approximations do not hold for the Equator (where Coriolis force is null) and require modifications [5]. Comparing thermal field measurements from Voyager and Cassini (shown in Figure 3), you can find that the latter points to a strong vertical wind shear, while the former speaks of quite a different atmosphere. Low meridional temperature gradients imply small vertical shear, so, even if the winds were measured deeper in the atmosphere than we estimated, wind speeds would have been basically the same at all levels. Nothing like the situation we are seeing with Cassini.
In short, both direct cloud tracking and temperature retrievals support the idea of a changing equatorial atmosphere. Leaving aside its unknown causes, this phenomenon could be linked to the semi-annual oscillation (SAO) already detected in Saturn far above the cloud tops into the stratosphere 5. The agreement is not perfect and the coupling with the upper troposphere is difficult to explain with our current understanding of the atmosphere, but the detection a few years ago of a strong high-altitude jet at zero latitude 6 also supports that such link may exist.
So far we have seen a number phenomenological issues that lay on our table like pieces of a puzzle. We do not know yet how they match each other. Even worse, as general circulation models fail to explain the general characteristics of the Equatorial jet, we have even lost the box of the puzzle and do not know what to expect. Now that we are facing the end of Cassini mission it is time to reconsider our strategy: more observations, better numerical models and reanalysis of old data may some day reveal the secrets of Saturn’s Equatorial jet.
References
- A. Sánchez-Lavega et al. (2016), An enduring rapidly moving storm as a guide to Saturn’s Equatorial jet’s complex structure, Nature Communications, doi: 10.1038/NCOMMS13262 ↩
- A. Sánchez-Lavega et al. (2003), A strong decrease of Saturn’s equatorial jet at cloud level, Nature 423, 623 – 625, doi: 10.1038/nature01653 ↩
- C.C. Porco et al. (2005), Cassini imaging science: first results on Saturn’s atmosphere. Science 307, 1243 – 1247, doi: 10.1126/science.1107691 ↩
- S. Pérez-Hoyos and A. Sánchez-Lavega (2006), On the vertical wind shear of Saturn’s Equatorial jet at cloud level, Icarus 180, 161 – 175, doi: 10.1016/j.icarus.2005.07.011 ↩
- L. Li et al. (2011), Equatorial winds on Saturn and the stratospheric oscillation, Nature Geosciences 4, 750 – 752, doi: 10.1038/ngeo1292 ↩
- E. García-Melendo et al. (2010), A strong high altitude narrow jet detected at Saturn’s Equator, Geophysical Research Letters 37, L22204, doi: 10.1029/2010GL045434 ↩
1 comment
[…] entrada es una traducción de la originalmente publicada en Mapping Ignorance. Pincha aquí si quieres leerla. Esta entrada está también basada en la nota de prensa publicada por la […]