Common boundaries in Solar System atmospheres
Common boundaries in Solar System atmospheres
As a child I was told that Earth’s atmosphere has a number of layers: troposphere, stratosphere, mesosphere, thermosphere, ionosphere and exosphere (hope I have not forgotten anything in the list!). This looked much like an onion and, to be honest, the taxonomic subtleties did not make much sense to me at that point. Aside from the memory exercise we are sometimes asked for in the primary school, the interesting point comes when you start thinking about the physics lying behind this classification. To make the big picture even more appealing, you can compare ours with other planets of the Solar System having thick atmospheres. By doing so, you discover not only a number of differences between them but also a bunch of similarities which are even more striking when you consider the intrinsic dissimilarities between the planets. This is what have been recently shown by Robinson and Catling in a paper published in the Nature Geoscience magazine 1.
Let’s focus on the first two elements in the list above: troposphere and stratosphere. As a planetary scientist, I am currently particularly interested in the things happening here since this is the place where most of the visible and infrared radiation is reflected and emitted. These two layers account in fact for most of the mass in any known atmosphere. They are usually defined in terms of the vertical temperature structure 2 with the troposphere showing a decrease of temperature with height (what we technically call a negative lapse rate) and the stratosphere just the opposite. In between, the singular point is usually called the tropopause. You can see in Figure 2 the situation for the planets and moons of the Solar System with thick atmospheres.
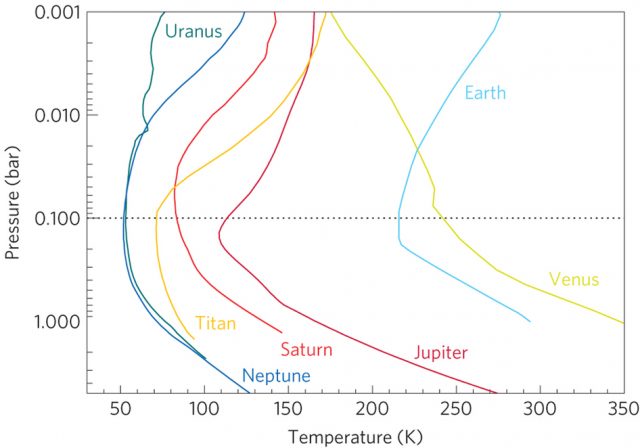
In terms of comparative planetology, we have a Figure 2 very different situations: while some atmospheres are dominated by CO2 or N2, other are mainly composed of H2 and He, the lightest gases available with a substantially different chemistry. Distances from the Sun are also extremely variable, causing a broad range of temperatures from the hot Venus to the cold Uranus and Neptune. However, it is striking to note that all of them (well, all except Venus for reason yet to discuss) display a tropopause at very much the same level. But, why this happens?
This is the intriguing question studied by Robinson and Catling in their work. For doing so, they developed a relatively simple 1-D model to account for the temperature structure of the atmospheres under very different conditions. This model accounts for the solar and infrared radiation absorption but also for diffusion and convection. However, it is known 3 that the infrared opacity is a power law of pressure. The exact coefficient depends on which kind of absorption is dominant at each atmospheric level. In the higher atmosphere, absorption is dominated by Doppler broadening of the lines produced by the atmospheric constituents (yielding a power of 1), while below the middle stratosphere the absorption is mainly pressure-broadened and collision-induced resulting in an infrared opacity proportional to the square of pressure, regardless of which particular species is absorbing radiation. This model is able to give an analytical expression of temperature and, setting the derivative of this function to zero, it is fairly simple to find not only the minimum of temperature (namely the tropopause) but also the conditions under which such a minimum will develop.
This model provides a general rule for finding the tropopause in any planet with a thick atmosphere with some exceptions. Venus has been already stated as lacking a proper tropopause. This is true for the global mean, but not for some latitudes of the planet with a stratospheric temperature inversion, where a tropopause can indeed be found. So Venus is only an exception in the global mean. Mars (not shown in Figure 1) does not have thick atmosphere and it also lacks a short-wave absorber so it does not fall inside the scope of this model. Some other exceptions might be tidally locked extrasolar planets even though they have a stratospheric temperature inversion (such as HD209458b). However, the prediction works both for oxidizing (Earth) or reducing (Titan and giants) atmospheres and for fast (Jupiter and Saturn) as well as slow rotators (Titan).
Aside from understanding a little better our own atmospheres, this result has also a direct application to the search of life in other planets. In the near future, we expect to retrieve spectra of exoplanet atmospheres; assuming a 0,1 bar pressure tropopause can help to determine the surface temperature in a much more accurate way and therefore to determine the feasibility of finding liquid water on them. As scientists we are happy to find rules that seem appropriate for a variety of conditions broader than those that were used to derive them, but it is even more important to understand how a few similarities in the process operating in the physical system are able to produce common features in spite of all the differences that are also present.
References
- Robinson T.D. & Catling D.C. (2013). Common 0.1 bar tropopause in thick atmospheres set by pressure-dependent infrared transparency, Nature Geoscience, 7 (1) 12-15. DOI: 10.1038/ngeo2020 ↩
- A. Sánchez-Lavega (2011). An introduction to planetary atmosheres. Taylor & Francis, Florida (USA). ISBN: 978-1-4200-6732-3 ↩
- J.B. Pollack (1969). Temperature structure of nongray planetary atmospheres. Icarus 10, 301 – 313 ↩