The use of natural fluorescent proteins for studying life
The use of natural fluorescent proteins for studying life
Some jellyfish species are beautifully fluorescent in the dark ocean, emitting light from different parts of their bodies in a process that is thought to help them to warn off predators. The molecular biology behind this process of glowing is possible thanks to one of the most famous proteins in molecular biology, the green fluorescent protein (always abbreviated as GFP), which discovery and development led to Osamu Shimomura, Martin Chalfie and Roger Tsien to be awarded with the Nobel Prize in Chemistry in 2008.
These discoveries have been crucial for today’s biological science since with the help of GFP we are now able to visualize processes that were previously invisible to us. Now we can attach a GFP molecule to any invisible protein of a cell or organism and make it visible, allowing us to see how those proteins move, where they go or how they are degraded or synthesized, leading to discover many protein malfunctions associated with several illnesses and diseases.
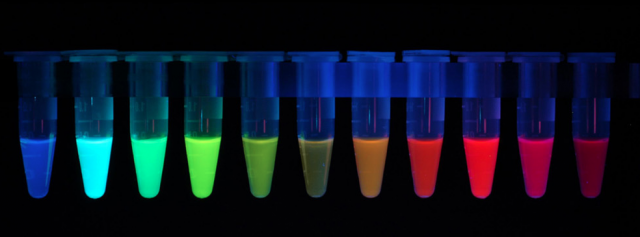
GFP, as it name says, emits green fluorescent light (wavelength of 509 nm). However, it is not the only molecule in nature that emits fluorescence and in the last years other molecules emitting in other colors have been discovered and optimized for biological research, producing (together with optimized GFPs) a really useful expanded color palette to visualize different proteins, biological structures or different cells in an organism at the same time (each marked with a color of interest). One beautiful example of the use of the whole palette of fluorescent colors is the so-called Brainbow, an outstanding technique developed by Jeff Lichtman at Harvard that biologically decorates different types of neurons with different colors and facilitates a lot, for example, the study of brain connectivity (i.e., how neurons are interconnected inside the brain).1

It seems that after these improvements one could see almost anything in a cell or animal, but this tagging technique has its limitations. The GFP itself its quite big and, for example, one definitely cannot use it for tagging ions (such as calcium or protons) or small molecules (such as glucose or neurotransmitters) since the GFP would be so big that when attached to them would instantaneously block the function of these molecules. Clearly, to study these small actors of the cell the strategy has to be different, but in the beginning nobody knew how to approach the problem. Fortunately, there is always someone in the scientific community smart enough to overcome almost any issue. One example is James E. Rothman (Yale University), awarded in 2013 with the Nobel Prize in Physiology or Medicine, who modified the structure of GFP making it sensitive to pH 2. After Rothman’s protein engineering, the newly designed GFP became fluorescent only at neutral and basic pHs (e.g. pH 7.4) whereas at acidic pHs (pH 5.5) was completely dark. This GFP-derivative, called pHluorin, has helped a lot the scientific community since it can be used to study trafficking (yes, as it sounds – cells also have their “highways” to move proteins through different locations!). Different steps of this trafficking process are associated with different pHs and therefore the fluorescence you see can be a readout of where the protein is.
Another nice example of a GFP-derived improvement to visualize small ions is the generation of GFP-based calcium sensors. In this case the protein engineering was originally made by Keiji Imoto (National Institute for Physiological Sciences, Okazaki). Prof. Imoto decided to put together a GFP and a piece of one protein that binds calcium (calmodulin) creating a chimeric protein they called GCamP. The result was that every time the calmodulin part of the chimera bound calcium, the GFP part increased its own fluorescence. Therefore, the more calcium is surrounding this chimera, the more calcium binds to it and bigger is the fluorescence observed 3. Since calcium goes inside neurons when these are active (i.e., they are transmitting information to other neurons), visualizing how calcium is changing in a neuron is the perfect readout to measure neuronal activity.
One beautiful experiment visualizing active neurons in brains of zebrafish was published this July in Nature Methods by Misha Ahrens’ team at Janelia Farms (a US-based state-of-the-art institute very well known for developing innovative techniques in molecular biology). By targeting these calcium sensors inside the neurons of the fish brain, Ahrens’ team was able to see how neurons are firing in the brain of the fish as it swims by visualizing how calcium goes inside the neurons using these sensors. The video they recorded is simply spectacular, visualizing at least 80% of the neurons of the brain in action and showing the “electrical storm” of swimming zebrafish “thinking” with incredible detail 4.
Video 1. Visualization of neuronal activation in zebrafish brain during regular activity. | Credit: Ahrens Lab, HHMI/Janelia Research Campus.
Although calcium increase is a great readout of the activity of a neuron, it is a process that is happening as a consequence of the real electric stimulation of the neuron in which the neuronal membrane potential is actually changing (rapidly rises and falls) producing the so-called action potential. Formerly, these electric changes in neurons could only be measured with electrodes while puncturing the membrane of the neuron with a micropipette, altering the structure of the neuron which could modify the final results of the experiment. However, thanks to very recent discoveries we now can measure electric changes in cells using a fluorescent protein! How is this possible?
Well… thanks to a quite rare microbe! This particular microbe, Halorubrum sodomense, possesses a protein called Archaerhodopsin which changes its fluorescence depending on the potential of the microbial membrane. Therefore, targeting this microbial protein to the membrane of a neuron allows researchers to see directly electrical changes in neurons without altering the neuronal structure using electrodes 5. Moreover, using this technique we now can measure voltage changes in regions smaller than the size of the electrode, which were completely inaccessible before, showing for the first time that there are actually some differences in how big are the voltage changes during neuronal activity in different parts of the neuron 6.
As it sounds, fluorescent protein research seems to have no limit. And, what is more exciting, fluorescent protein engineering can now be combined with the recent advances in microscopy showing new biology that we was completely inaccessible before. One outstanding example is the use of lattice light-sheet microscopy (developed by the Nobelist Eric Betzig) to visualize fluorescent proteins in killer T cells and target cells. These killer cells are a type of white blood cells that play a key role in immunity, helping to destroy damaged/infected cells in the body. Here the video shows for the first time a 3D perspective of how some proteins move in living T-cells (orange) while these try to destroy infected/damaged cells (blue) as they do naturally 7. Isn’t it amazing?
Video 2. Two-color video seen from two different orientations of the interaction of a killer T cell marked in orange helping to destroy a target cell marked in blue. All 4 squares are from the same process, just showing different perspectives of the cellular interaction (with or without the target cell shown). | Credit: Betzig Lab, HHMI/Janelia Research Campus; Lippincott-Schwartz Lab, National Institutes of Health. You can find more videos of this technique here.
References
- Livet, J., Weissman, T. A., Kang, H., Draft, R. W., Lu, J., Bennis, R. A., … & Lichtman, J. W. (2007). Transgenic strategies for combinatorial expression of fluorescent proteins in the nervous system. Nature, 450 (7166), 56-62. ↩
- Miesenböck, G., De Angelis, D. A., & Rothman, J. E. (1998). Visualizing secretion and synaptic transmission with pH-sensitive green fluorescent proteins. Nature, 394 6689), 192-195. ↩
- Nakai, J., Ohkura, M., & Imoto, K. (2001). A high signal-to-noise Ca2+ probe composed of a single green fluorescent protein. Nature biotechnology, 19(2), 137-141. ↩
- Vladimirov N., Takashi Kawashima, Davis V Bennett, Chao-Tsung Yang, Loren L Looger, Philipp J Keller, Jeremy Freeman & Misha B Ahrens (2014). Light-sheet functional imaging in fictively behaving zebrafish, Nature Methods, DOI: http://dx.doi.org/10.1038/nmeth.3040 ↩
- Kralj, J. M., Douglass, A. D., Hochbaum, D. R., Maclaurin, D., & Cohen, A. E. (2012). Optical recording of action potentials in mammalian neurons using a microbial rhodopsin. Nature methods, 9 (1), 90-95. ↩
- Hoppa M., Moritz Armbruster & Timothy A. Ryan (2014). Control and Plasticity of the Presynaptic Action Potential Waveform at Small CNS Nerve Terminals, Neuron, 84 (4) 778-789. DOI: http://dx.doi.org/10.1016/j.neuron.2014.09.038 ↩
- Chen, B. C., Legant, W. R., Wang, K., Shao, L., Milkie, D. E., Davidson, M. W., … & Betzig, E. (2014). Lattice light-sheet microscopy: Imaging molecules to embryos at high spatiotemporal resolution. Science, 346 (6208), 1257998. ↩
2 comments
[…] aukera ematen dute teknika hauek. Jaime de Juanek azaltzen digu, bi bideo ikusgarri dituen The use of natural fluorescent proteins for studying life […]
[…] Beautiful complexity “@andyextance: The ‘brainbow': Cells tagged with fluorescent proteins” […]