Clouds of stone in a distant world
Clouds of stone in a distant world
Even though the Kepler mission stopped working in May 2013, the data provided by this extremely prolific mission still wonders the scientific community. The mission discovered some 150 planets and proposed more than 3,500 candidates, supplying the basis for a realistic estimation of the number of planets in our Galaxy, whether Earth-like or not. Now, a careful analysis of this huge database has demonstrated for the first time the presence of clouds inhomogeneous covering one of its planets 1, as depicted in Figure 1.
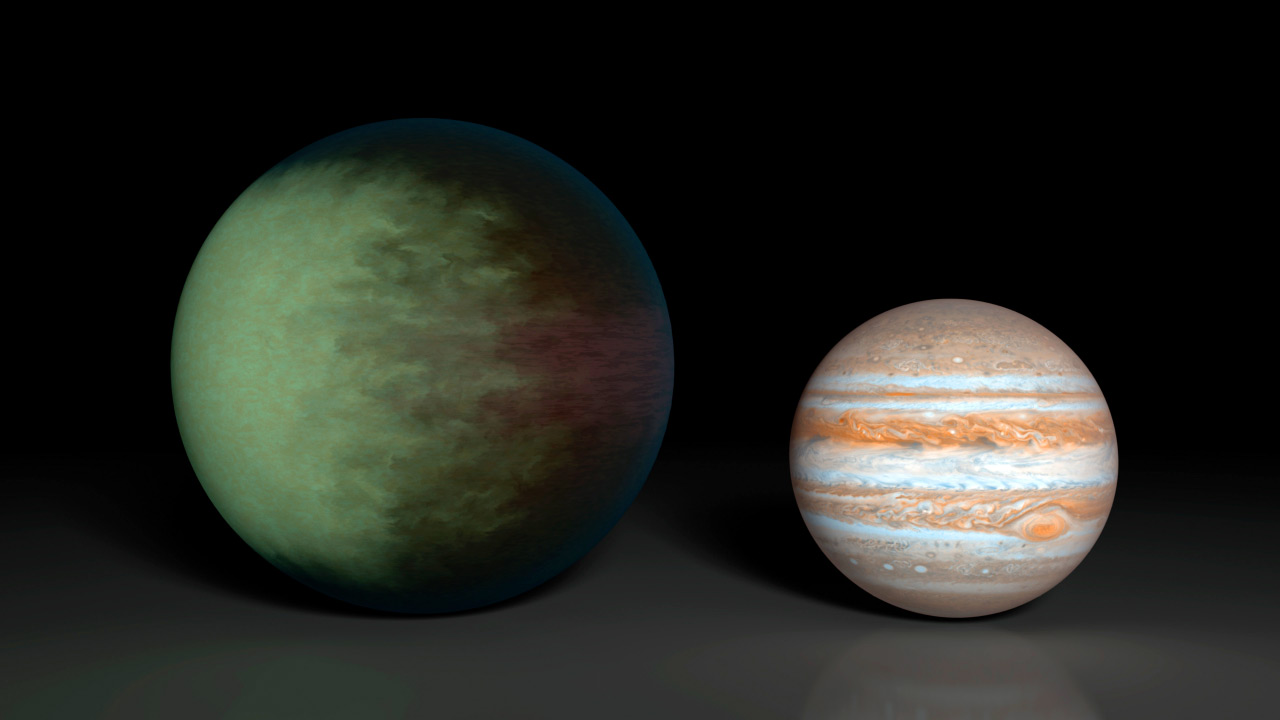
Kepler-7b is what we usually call a “hot Jupiter”, orbiting a star similar to our Sun in less than 5 days. Being so close to its parent star, it is a 50% bigger than Jupiter though its mass is lower, resulting in a very low density, about one sixth of that of liquid water. This makes it one of the most inflated planets up to date, second only to WASP-17b 2. It also has an unexpectedly large albedo, since it reflects more than one third of the light coming from its star.
In order to better understand the physics of this planet, Brice-Olivier Demory and his collaborators started studying two of its occultations using the Spitzer Space Telescope at 3,6 and 4,5 μm. No transits were observed at these wavelengths. Far from being a failure, this served to put an upper limit to the outgoing flux in this part of the spectrum or, in other words, to the brightness temperature of the planet (1,700 – 1,840 K).
Now, the astonishingly large database of Kepler-7b observations from the Kepler spacecraft provided a beautiful insight into how the planet was scattering the radiation coming from its star. Kepler had observed the planet for more than 1,200 days almost continuously. This made it possible to see one transit after another and to reduce the noise over what is usually called the phase curve.
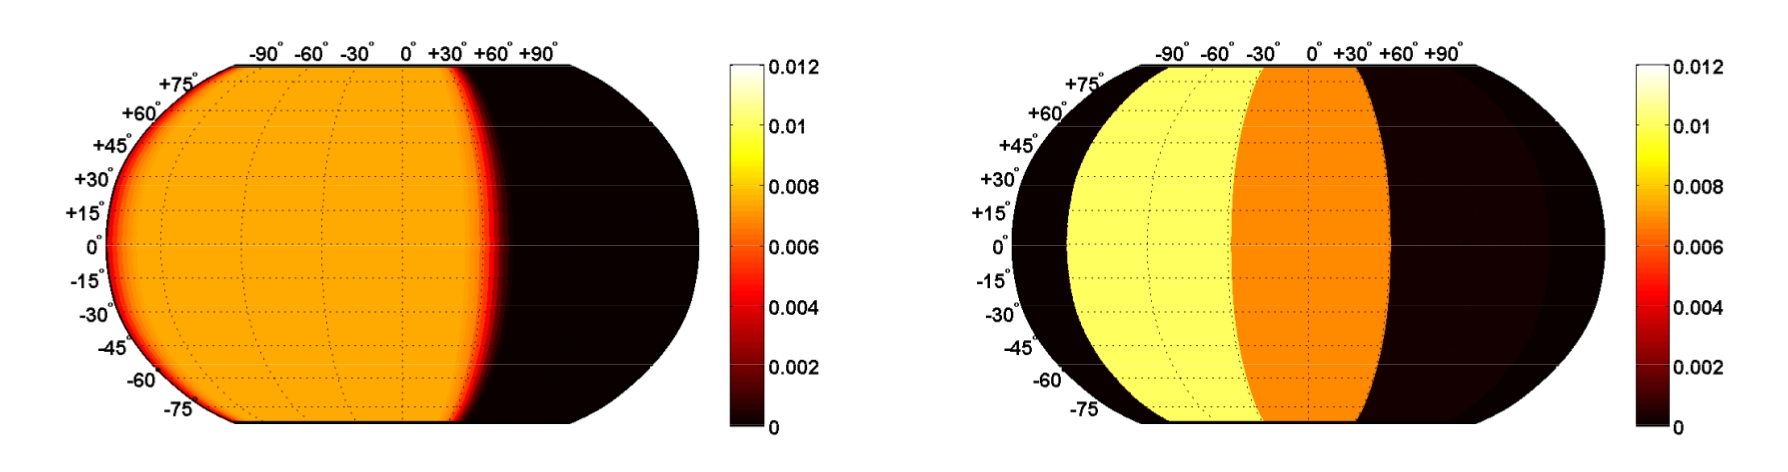
A phase curve plots the variation of flux received from the star plus planet system as a function of the orbital phase, or the position of the planet on its orbit around the star. Variations on this curve can be the smoking gun for the presence of clouds or even topographic features in distant worlds. Cloud particles do not disperse radiation equally in all directions and this can be seen in the phase curves. Unfortunately, such effects are ridiculously small and had always fell inside measurement noise for the case of extrasolar planets. This time, however, a combination of a broadly distributed database and a careful statistical analysis of the data has been proved enough to reveal this elusive effect on the observed flux.
We show in Figure 2 how Demory et al. propose that the observed phase curve could be produced. Current data exclude the Rayleigh scattering that appears from molecular hydrogen although they cannot distinguish between some other subtleties. In any case, the cloud distribution seem to be strongly inhomogeneous, as Figures 1 and 2 show.
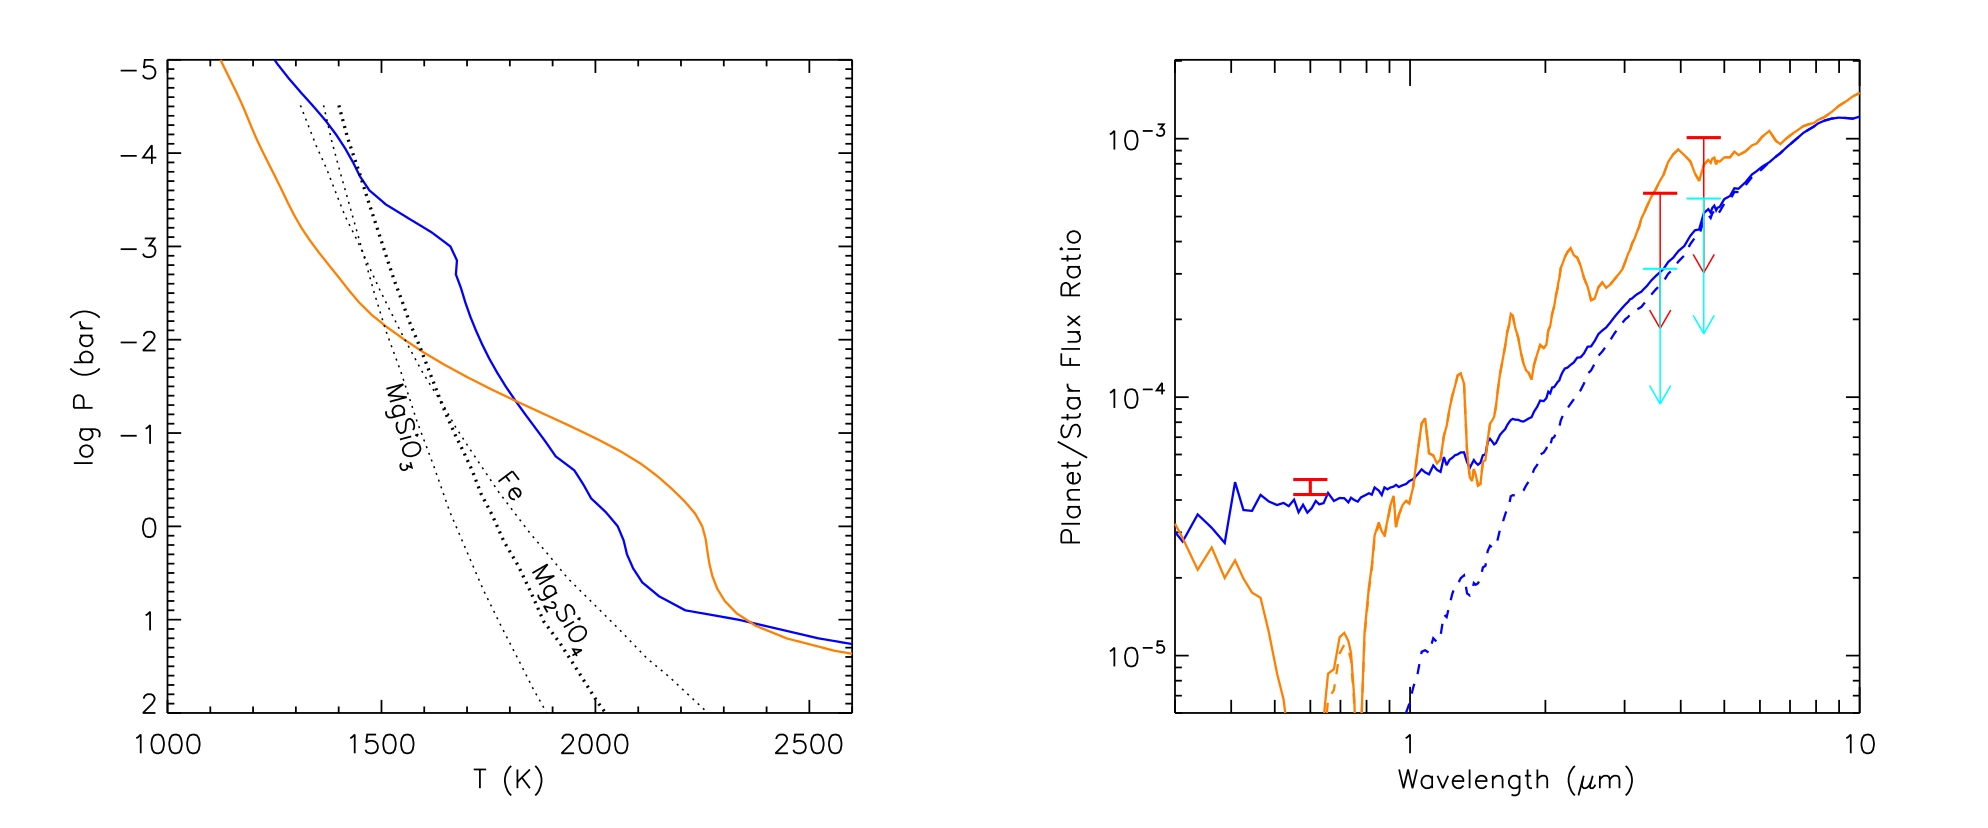
What kind of cloud can be found in such a distant and strange world? It is possible to derive the formation of condensation clouds by a simple application of the Clausius-Clapeyron equation. Sometime ago, we proposed this as an exercise for physics undergraduates studying thermodynamics 3. You only need to know the pressure-temperature profile the planet (often retrieved by in-situ probes or by remote sounding techniques) and the saturation vapor curves for the potential candidates (commonly obtained at the lab and broadly available in the literature). Whenever the partial pressure of the vapor exceeds the saturation vapor pressure, condensation occurs and we can locate the cloud base. This idea can be easily applied to Solar System as well as extrasolar planets. The only difference, which is trivial in terms of the laws of physics, is that the high temperatures in hot Jupiters require not water, ammonia or methane but refractive materials instead.
The expected clouds for Kepler-7b are formed by silicates, as shown in Figure 3. These “clouds of stone” would condense and precipitate exactly the same as water clouds in Earth. Strange as it may seem it is simply the consequence of having higher temperatures. This is what one can find at hot Jupiters or brown dwarfs. And, in fact, this expectation is in good agreement with the constraints imposed over the outgoing flux from the planet at some wavelengths, as also graphed in Figure 3.
This is most likely just the tip of the iceberg. As a planetary scientist specialized in cloudy planets, I expect this to be just the first of an increasingly large number of similar discoveries. As the authors of paper discussed here just point out, future narrow-band and polarimetry observations will show the process of cloud formation all over the Galaxy, from this exotic silicate clouds to the old, good and familiar water clouds in our blue planet.
References
- Demory B.O., de Wit J., Lewis N., Fortney J., Zsom A., Seager S., Knutson H., Heng K., Madhusudhan N. & Gillon M. & (2013). INFERENCE OF INHOMOGENEOUS CLOUDS IN AN EXOPLANET ATMOSPHERE, The Astrophysical Journal, 776 (2) L25. DOI: 10.1088/2041-8205/776/2/L25 ↩
- David W. Latham et al. (2009). Kepler-7b: A Transiting Planet with Unusually Low Density. ArXiv:1001.0190, doi: 10.1088/2041-8205/713/2/L140 ↩
- A. Sánchez-Lavega, S. Pérez-Hoyos and R. Hueso (2004). Clouds in planetary atmospheres: A useful application of the Clausius–Clapeyron equation . American Journal of Physics, 72 (6), doi: 10.1119/1.1645279 ↩