On theory and observation (3): Scientists selling lemons, a game-theoretic analysis of how scientific facts are constructed
On theory and observation (3): Scientists selling lemons, a game-theoretic analysis of how scientific facts are constructed
In our trip through the philosophical discussion about the nature of observation in science, I propose to take a different route from the most classical ones, and probably a surprising one for most of you. Akerlof’s classic paper ‘The Market for Lemons’, one of the founding works of the Economics of Information, presented an idealised model of the market for used cars, in which sellers know the real quality of each car, but buyers are not able to distinguish good cars from bad ones before buying them and using for a time. The price buyers are willing to pay for good used cars (‘peaches’) is higher than the one they would pay for bad ones (‘lemons’), but, being not capable of noticing the difference between both types of cars in the lot, the clients would be willing to pay a price for every car which is equal to the weighted average of what they would pay for good and bad ones (the weights being equal to the known or estimated proportion of each kind). This price would be not accepted by sellers for good cars, for it is lower that these cars’ ‘real’ value, and hence, sellers will have an incentive to sell only bad cars, ‘lemons’. Of course, clients, knowing this, will only offer their price for bad cars, and good cars will disappear from the market (this is what economists call ‘adverse selection’).
Akerlof’s paper didn’t claim that the real market for used cars actually worked in the way his model depicted. Even, the concept of ‘used cars’ (or ‘lemons’) is employed in the paper not as literally referring to those specific goods, but as an illustration of any type of exchange in which the parts happen to have different information about what is exchanged. Akerlof explicitly mentions the labour markets, insurance markets, as well as underdeveloped economies and ‘the cost of dishonesty’, as other examples about which his theory could offer some useful insight. In a sense, what I shall try to do in this section is to include the process of creation of a scientific paper in the set of possible applications of Akerlof’s scheme (if not strictly of his model, since in the case I shall examine there are no ‘prices’).

The information asymmetry in the ‘market for lemons’ is about the intrinsic quality of a material good: sellers know the cars better than buyers. We may be tempted to ask if something similar occurs in the case of science, and to answer using a conceptual strategy similar to that of Akerlof (what has been called ‘economics of scientific knowledge’). To begin with, I think it is reasonable to claim that, because of the unavoidable ‘division of cognitive labour’, the authors of a scientific paper know much more than her typical reader about the work that has been carried out in order to elaborate the text (let’s consider, e.g., one paper that reports a laboratory experiment or field observation, or that uses these as arguments in favour of a conjecture, theory, etc.). Hence, we are here in front of an evident case of informational asymmetry. If the mythical, naïve positivist view of ‘the scientific method’ were right, there would be an algorithmic procedure to ‘translate’ the results of the experiments/observations into a text, so that the ‘final’ paper would simply become a transparent description of ‘the facts’. But every working scientist, as well as every historian, philosopher or sociologist of science worth his salt, knows that in the real world things are much more complicated.
A scientific paper necessarily offers just a selection, or summary, or interpretation (or all of it), of the empirical results and the steps that have been taken. The claim of the paper (either a ‘description’ of the results, or a conjecture supported by them) is one, but in principle it could have been different if a different interpretation or use of the results had been made. Papers that are co-authored (as most of them are in experimental science) show still more clearly that this ‘space of possibilities’ exists, because in this case co-authors ‘negotiate’ the specific content and claims that will be included in the final text. And in many cases, ‘negotiations’ between authors, referees, and editors can also be understood as attempts to make more congenial the content of the paper with standard ideas or practices within the discipline, or to disclose a little bit more of what the author has kept ‘concealed’ in the article’s first versions.
The process of writing of a scientific paper partly consists, hence, in choosing one text from a set of possible texts, all of these more or less ‘justifiable’ by the empirical results obtained by the authors. The relevant information asymmetry here lies in the fact that, in principle, the authors know the whole set of possibilities (what they ‘could have claimed’ given their results), but the readers only know just one of the possibilities, the one that has been chosen by the authors; i.e., the typical reader basically ignores what other papers the authors could have written using the same results. I insist: the ‘alternative results’ are hidden for the readers, for the only thing they get from the published paper is the specific description/interpretation of the results chosen by the authors. Naturally, one of the basic points of science is that these results must be reproducible, but ‘replication’ necessarily consists, at most, in producing a new, different set of results, whose description/interpretation will be assessed later in order to see whether it can be considered as coherent or incoherent with the original published report.
We can use the formal tools of economic analysis at this point to illuminate the author’s decision of choosing one particular way of expressing her results. The cloud of points H in fig. 1 represents the possible articles (or ‘hypotheses’) she might write on the basis of those same results. Our first question is, hence, what different properties or qualities each option has, so that some of them are ‘better’ from the point of view of our scientist? In order to keep the complexity of my argument at a minimal level, I will take into account only one pair of those qualities: the degree in which the scientist thinks one possible interpretation will resist future criticisms, and the degree in which she thinks the interpretation is original or innovative. I shall call these two properties ‘plausibility’ and ‘novelty’ respectively; they are represented respectively by the horizontal and vertical axes. I will also make the (extremely) simplifying assumption that every member of the relevant scientific community, i.e., all the potential readers of the paper our scientist is to write, would agree with her on the values of these two qualities for each possible interpretation if it were the chosen one. A couple of variables that may work as proxies for plausibility and novelty are the posterior and prior probabilities of the claim made in the paper, i.e., p(h/Eh&B) and p(h/B), where h H is the claim, Ehis the offered description of the empirical results if h is chosen, and B is all relevant background knowledge shared by the scientific community.
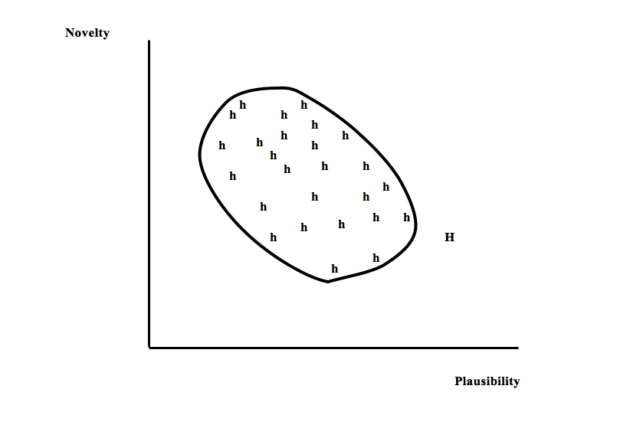
One important feature of the set H is that its ‘frontier’ in the upper right side of the graph will very likely have a negative slope. This simply means that, though the author may choose interpretations with a higher or lower value of each two epistemic variables, at some point it must be the case that improvements in one of the qualities (e.g., finding out a more plausible claim) can only be attained at the cost of decreasing the other quality (i.e., making it less innovative). The author might want to be capable of devising a paper that were better in both regards, but her results do not allow such an utopian accomplishment.
A second question is, how these values affect the author’s optimal choice? This will depend on the expected decision that readers will make about the paper. Simplifying again a lot, when one possible interpretation is made public, readers have two possible reactions: either accepting it or rejecting it. If the paper is rejected, the author gets a utility of 0. If it is accepted, it is reasonable to assume that the author’s utility basically depends on how ‘important’ the paper seems, and this will directly depend on its degree of novelty. Hence, a preliminary question for the author is to make a distinction between those h’s that will be accepted and those that will not. Assuming (again with a great dose of idealisation and simplification) that she shares with all her colleagues the disciplinary criteria about when are papers ‘good enough’ to become acceptable, the author will directly know the answer to this question just by being a member of her discipline. It seems reasonable to assume that these criteria depend on the two epistemic factors we have mentioned: plausibility and novelty; ‘good papers’ are those that have a sufficiently high degree of both qualities, with some room for higher degrees of one compensating, to some extent, lower degrees of the other. This entails that the epistemic indiference curves for the readers will be decreasing and convex [convexity means that a linear combination of two points x, y in the graph which are equally preferred, i.e., a point z lying on the straight line joining x and y, is necessarily preferred to each of them, i.e., U(z) > U(x) = U(y)], and representing a higher utility level as they are further away from the origin of the graph, as depicted in fig. 2. This figure also shows a thicker curve (UL) that is defined by being the lowest utility level the discipline has to get from one paper to become ‘acceptable’; hence, this represents the acceptability threshold: claims worse than that are rejected, and claims above the line are accepted.
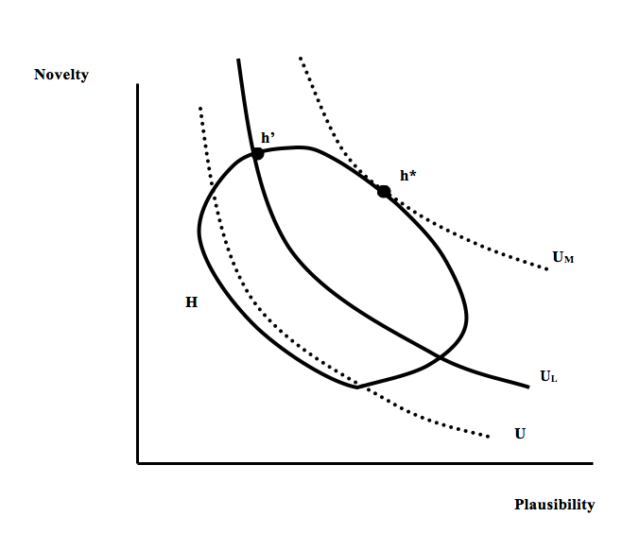
Knowing all this, our author’s choice is already determined: the best choice for her is to select the interpretation that is both over UL and that has the maximum possible novelty, i.e., the claim h’ of fig. 2. However, as it is also clear from the figure, it can easily be the case that h’ is not the paper that readers would have preferred if they had known all the possibilities, for their best choice (in the case depicted in the figure) would have been h*, i.e., the element of H which lies in their highest possible utility curve, UM. Stated differently: the existence of asymmetric information entails that the author’s optimum may not coincide with the community’s optimum. Under the idealised and simplified conditions depicted in my argument, the members of a scientific community will tend to produce papers that are not epistemically optimal from the point of view of their own epistemic criteria.
As it was the case with Akerlof’s paper, my analysis does not attempt to proof that this is an empirically accurate description of the process of writing and accepting scientific papers. It only identifies a tension that exists in the different interests of scientists depending on whether they are acting in their role of authors or in the role of readers. The main insight that can be gained thanks to looking at the creation of scientific knowledge from this viewpoint is that some scientific institutions or practices can be seen as attempts to resolve this tension (i.e., to persuade authors to select an interpretation of their results which is closer to the community’s optimum), or, instead, as factors that can end giving authors more freedom to select papers that are epistemically ‘too bad’. In the positive side we can mention institutions like peer review, that tends to downgrade the authors’ claims and to demand stronger justification for them, the existence of different journals of different average quality, i.e., with different UL thresholds in the sense of fig. 2, etc. In the negative side we find some problems like lack of incentives to replicate findings, excessive pressure for publishing, etc. In particular, a higher probability that the results are not externally checked tends to enlarge the set H of possible interpretations of the empirical results in the direction of the vertical axis, namely, including strong claims that are apparently but not really ‘justified’ by the actual results.
References
Akerlof, G., 1970, “The Market for Lemons. Quality Uncertainty and the Market Mechanism”. Quarterly Journal of Economics. 84(3): 488–500.
Zamora Bonilla, J., 2019, “The Market for Scientific Lemons”, Theoria, 2019, 34(1), 133-145.