Saturn’s extreme weather in the computer
Saturn’s extreme weather in the computer
Saturn is truly a weird place. Apart from having quite a peculiar thermal history and one of the most interesting satellites in the Solar System, this planet displays arguably the most fascinating meteorological phenomenon ever seen. Suppose for a moment that next spring a storm raises in your hometown. Nothing unusual to care about, probably. Now imagine that the storm grows and grows, extending around the globe. After a few weeks, the storm covers continents and oceans close to your original latitude. Satellites would record an astonishing belt around the planet. Eventually, the storm is so stretched that the head catches up with the tail making it to dissipate. Weird enough? Well, this is what happens in Saturn approximately every 30 years or so, in late 2010 for the last time. Now, detailed simulations of this last storm has revealed that the physics underlying such extreme event are relatively simple 1.
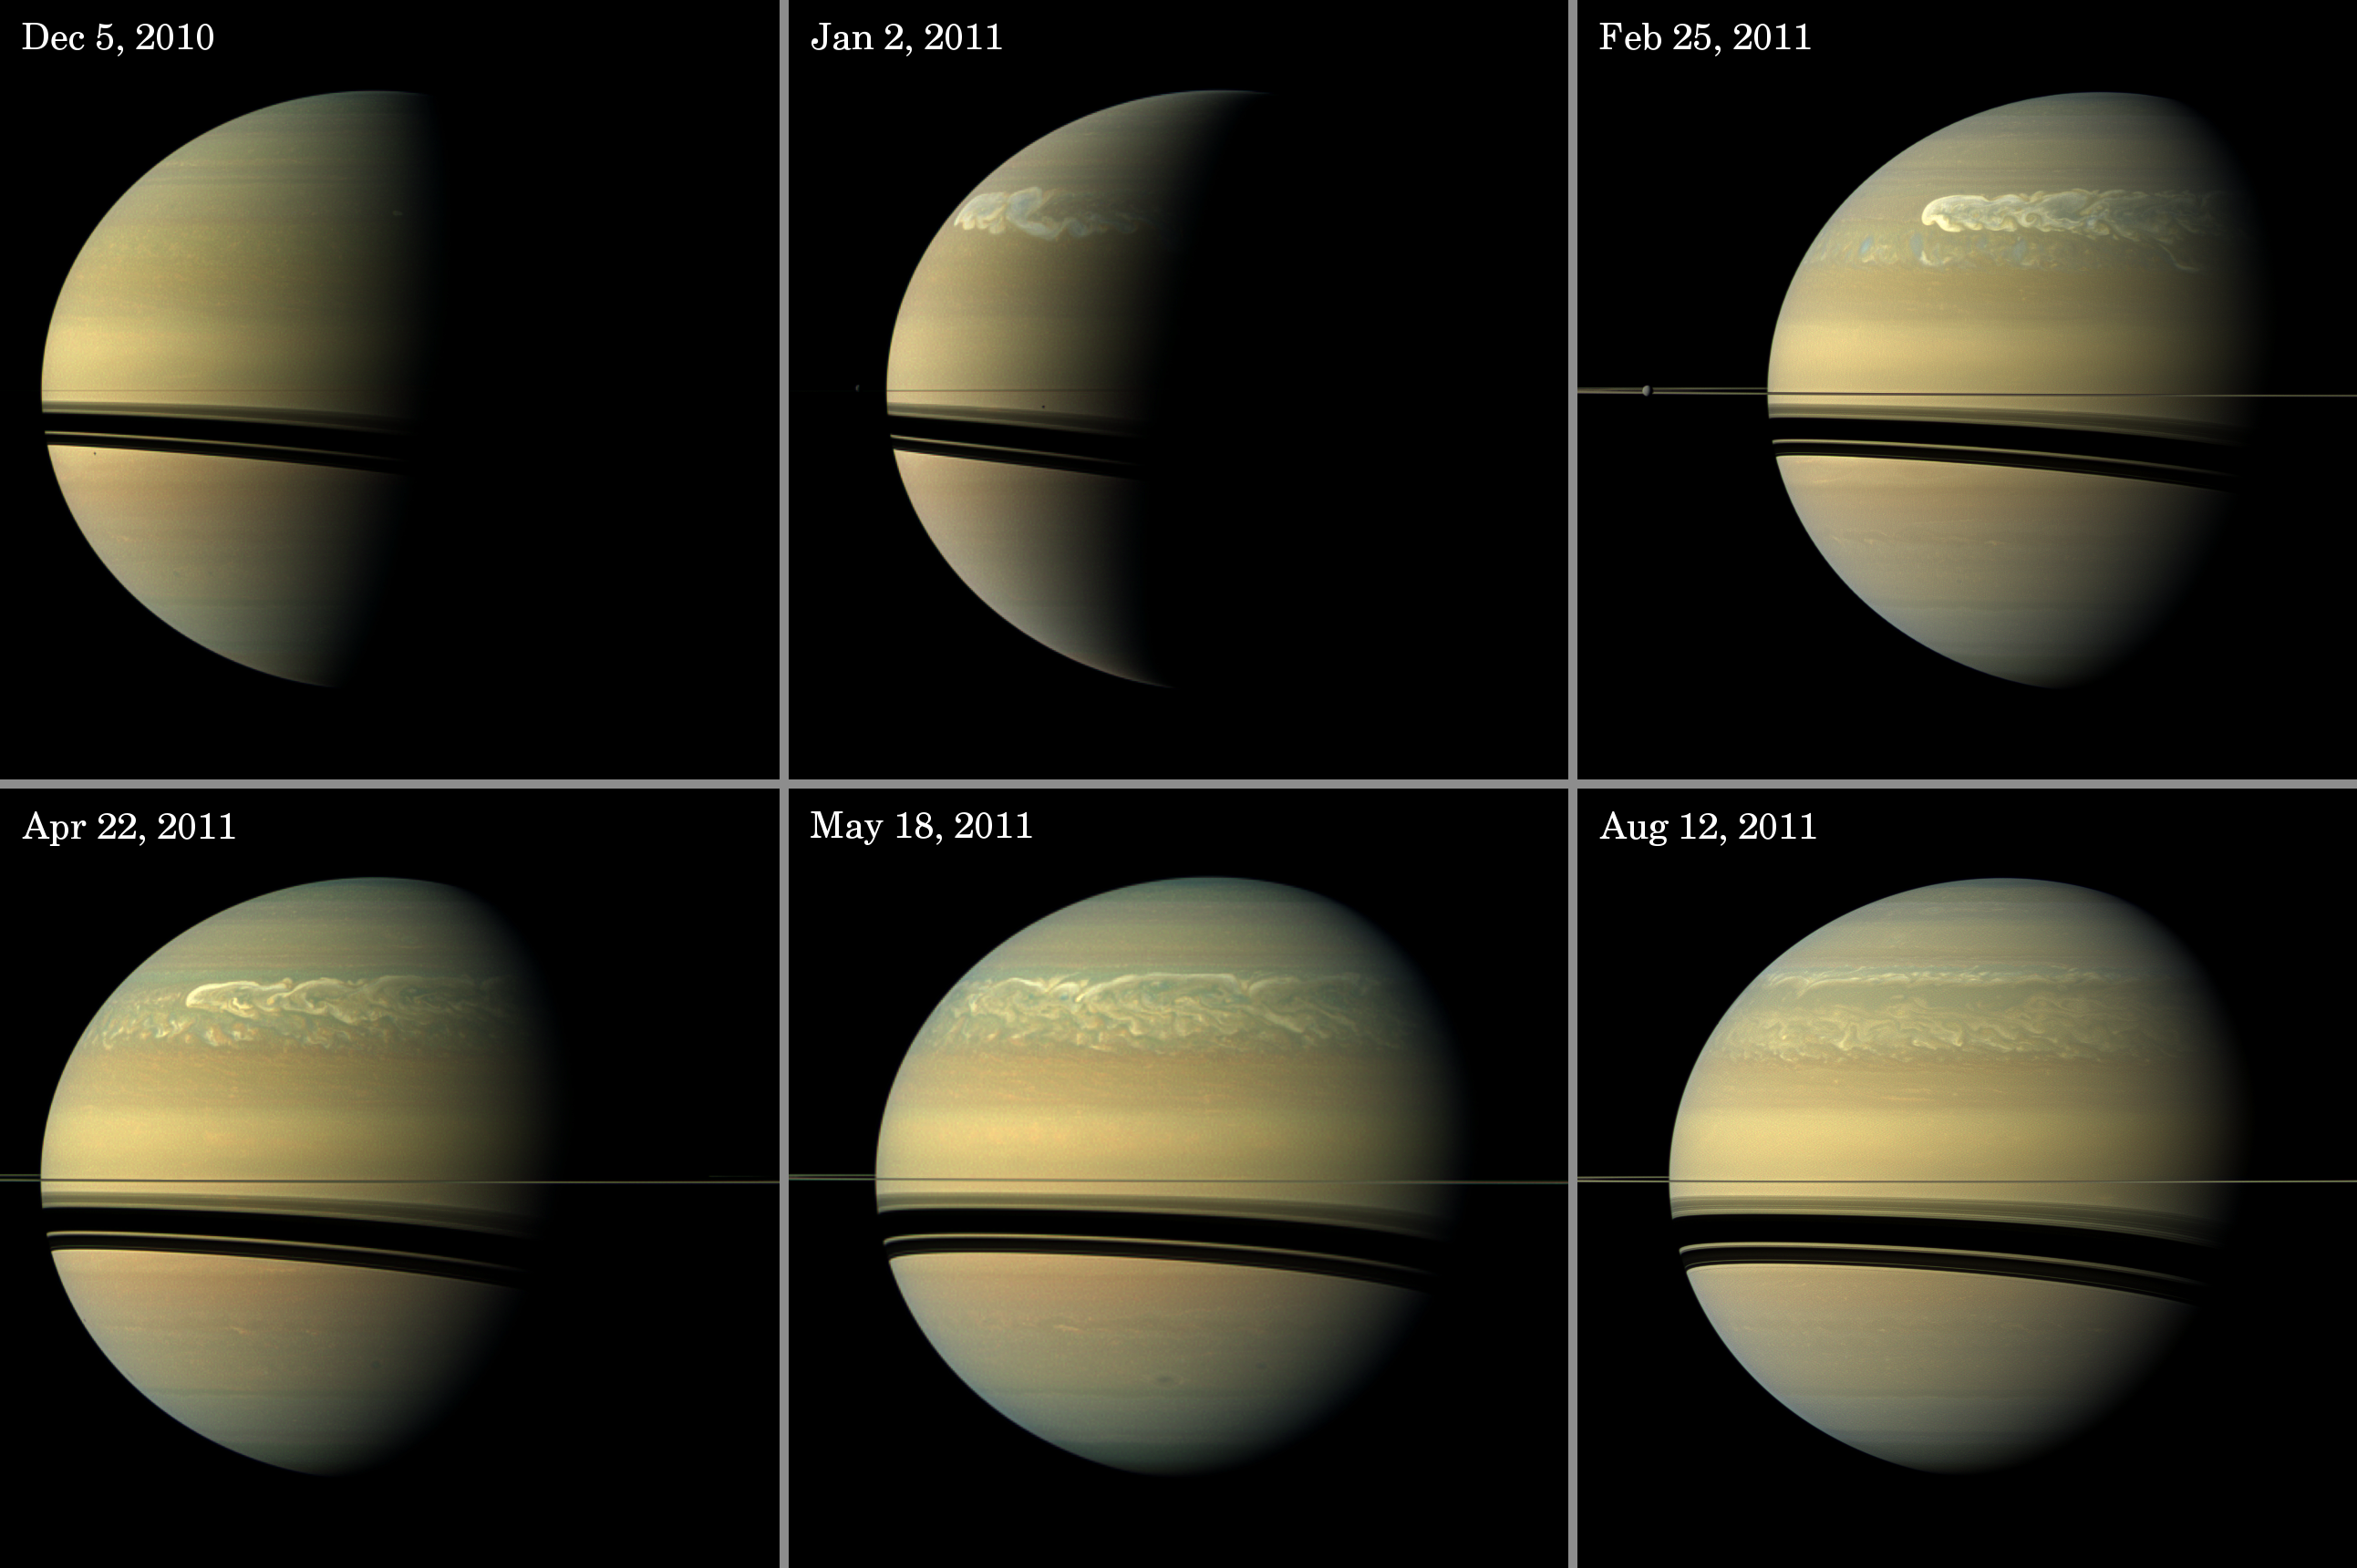
The first record we have of such a gigantic storm dates from 1876. At that time astronomers did not have the chance to reflect what they saw at the eyepiece except by drawing it. The famous astronomer Josep Comas i Solà made some beatiful drawings in 1903 that astonishingly resemble the images returned in 1990 by the shortsighted Hubble Space Telescope (that was before the optics were corrected in 1994). But prior to high-resolution imaging, most astronomers only saw a bright spot on Saturn’s disk and so the storms were nicknamed Great White Spots (GWS). Should we continue to use such name now that we are able to discern their majestic complexity? Well, gigantic storms are indeed Great and White (at least in the visible wavelengths) and while they can no longer be viewed as Spots, except at toy telescopes, let’s preserve this nomenclature for the sake of tradition and for having the sense of being witnesses to a rare phenomenon first noticed in the XIX century.
Now that we have Cassini spacecraft orbiting Saturn we did not only see the evolution of the 2010 storm but also hear it 2. The storm emitted intense electrostatic discharges detected by the radio experiments onboard Cassini, those discharges would be related to lightning and thunderbolts that, as happens in Earth, are expected in the presence of vigorous convection. The 2010 GWS also produced an unexpected warming in the stratosphere above the storm which was about 60 K colder before the eruption started 3. Previous works had shown that the gross evolution of the storm required the atmospheric winds must extend down to levels much below the sunlight penetration depths 4 and of course below what we can usually see in Saturn.
So, what’s new regarding Saturn’s storm? The paper presented by Enrique Garcia-Melendo, an researcher from the Fundació Observatori Esteve Duran (Spain), and his collaborators (of which I am a proud and lucky one) has dissected the storm front and reproduced its behavior by means of numerical models. Using high-resolution images taken by Cassini Imaging Science Subsystem (ISS) camera on February 2011, this work deals with a number of different aspects of the storm and then translates them into a comprehensive numerical modelization.
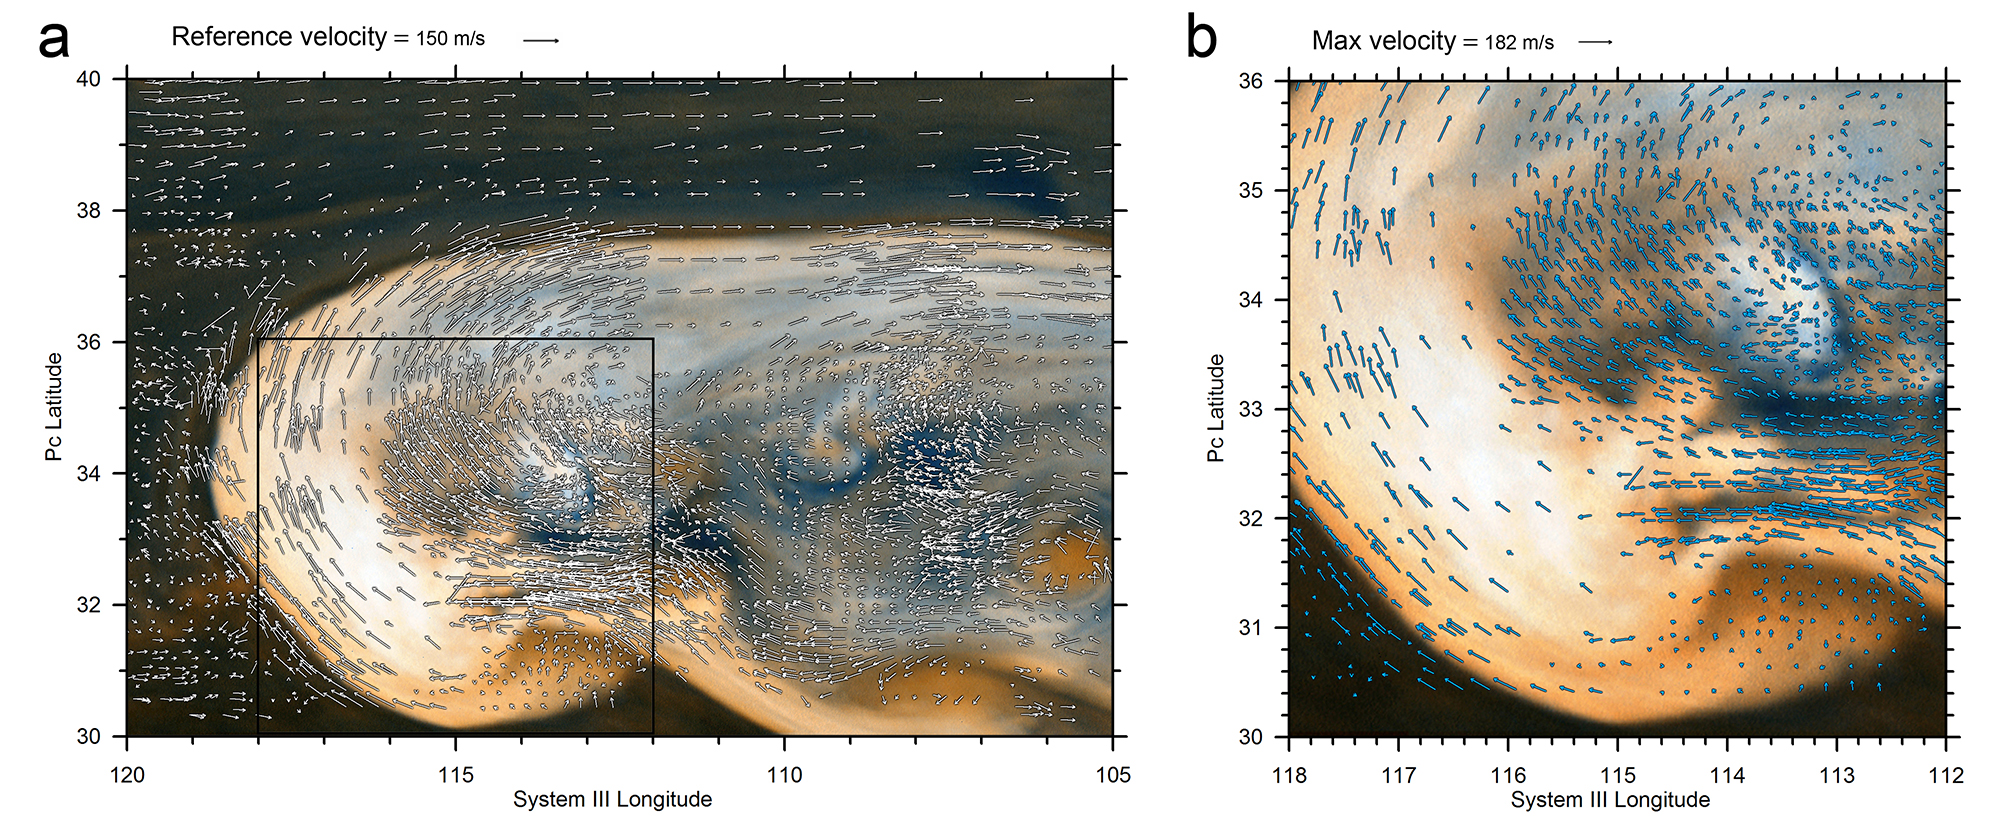
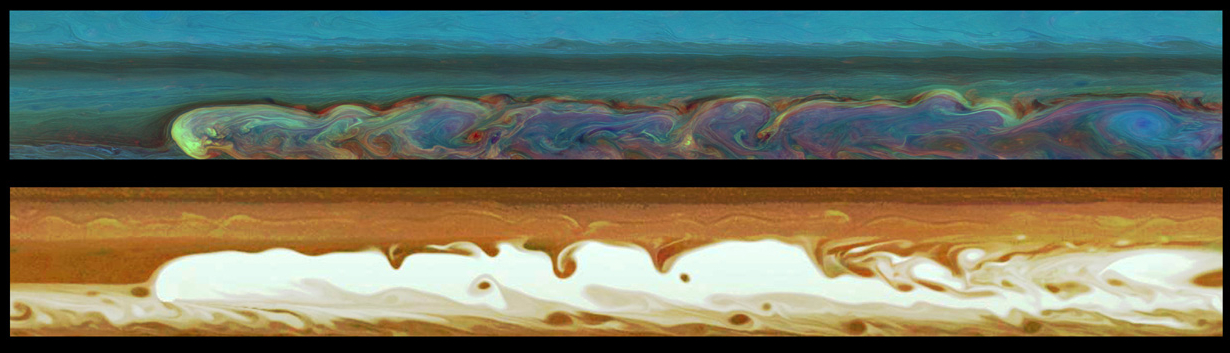
The Cassini ISS images are able to image Saturn at a maximum resolution of about 30 km per pixel. This superb resolution allows measuring the finest and most subtle details in Saturn’s atmosphere. Think of this somewhat like lying in the ground in a peaceful summer afternoon and enjoying the evolution of clouds in our own sky. The biggest ones may show a more regular behaviour, but if you look into the smallest clumps then you will find quite a faster and variable evolution. In a very similar fashion, Saturn seen at such enormous amplification requires images not be very separated in time so one can identify the very same cloud features at different times and positions. If you are able to do so, then you will be tracing the atmospheric flow simply by using 101 Physics. This feature identification is done by means of automatic correlation techniques but also by human supervision in some cases. By doing so, García-Melendo and collaborators determined wind speeds of more than 500 km/h in a compressed region preceding the storm that displaces clouds equatorwards.
This dynamical description of the GWS is impressive but just instrumental in terms of the goals of the paper discussed here. What do we need to reproduce extreme dynamics? Using numerical simulations is possible not only to reproduce but also to understand the physics underlying phenomena. The authors use two approaches. One is a very detailed fluid dynamics code (Explicit Planetary Isenthropic Coordinates model or EPIC developed by Tim Dowling and his team), but also a much simpler, shallow water model. Both agree in describing the GWS as the natural response of the atmosphere to a continuous injection of material. Most of the basic features arise just by inserting a sustained disturbance in the average flow of the atmosphere. Such disturbance is assumed to be convection, most likely from water clouds deep in Saturn’s atmosphere. This convection ascends and accelerates through the atmosphere, elevating the convective towers up to 40 km above surrounding clouds.
Although the agreement between observations and models is fantastic, a number of questions remain. My two favourite ones are: what feeds the GWS? and why every 30 years? But there are more caveats. Just to mention one, all the GWS events observed up to date happened in the northern hemisphere of Saturn (many of them close to the Equator, but all in the North), none in the southern one. The feeling among the community is that it must have something to do with the 30 years long seasonal cycle but no one has been able to prove the link yet. It is not very likely that we will have anything similar to Cassini spacecraft orbiting Saturn around 2040 so best conceivable data are possibly already over the desk. Now it is time to scientits to work out the full puzzle.
References
- E. García-Melendo, R. Hueso, A. Sánchez-Lavega, J. Legarreta, T. del Río-Gaztelurrutia, S. Pérez-Hoyos and J.F. Sanz-Requena 2013. Atmospheric dynamics of Saturn’s 2010 giant storm. Nature Geosciences. d.o.i.: 10.1038/ngeo1860 ↩
- G. Fischer et al. 2011. A giant thunderstorm on Saturn. Nature 475, 75–77. d.o.i.: 10.1038/nature10205 ↩
- L.N. Fletcher et al. 2011. Thermal structure and dynamics of Saturn’s northern springtime disturbance. Science 332, 1413–1417. d.o.i.:10.1126/science.1204774 ↩
- A. Sánchez-Lavega et al. 2011. Deep winds beneath Saturn’s upper clouds from a seasonal long-lived planetary-scale storm. Nature 475, 71–74. d.o.i.: 10.1038/nature10203 ↩
1 comment
[…] 23 y 24 de junio aparecieron en el Cuaderno de Cultura Científica (zientziakultura) y en Mapping Ignorance, dos entradas relacionadas con el artículo: “E. García-Melendo, R. Hueso, A. […]