Muscle vs. Brain: perhaps a matter of energy expenditure
Muscle vs. Brain: perhaps a matter of energy expenditure

The human brain is one of the most intriguing pieces of Nature. Since science is science, or even before, the human being has tried to understand the reason for its existence. Studies of comparative anatomy and physiology in the context of evolutionary theory began to define it as a rarity in the natural realm. We humans possess a brain, which while not the greatest among all known living beings, it possesses the highest cerebral cortex-brain mass ratio. The cerebral cortex is paramount in matters making us human (or at least more developed in cognitive abilities than the rest of primates) like thought, complex language, and high degree of consciousness. Furthermore, we possess also a large brain comparatively with our body size among mammals. Additionally, our brain is quite expensive energetically. Taking approximately 20% of our energy stock even being less that 2% of our body mass. Those and several other facts and numbers seemed to support the uniqueness and exclusivity of our brain among animals.
Many attempts have being made to explain human brain from the evolutionary point of view. One of most famous ones: the “expensive-tissue hypothesis” was proposed in the nineties to explain our bigger brain as a result of an energetic trade-off between the size of the brain and digestive tract (which in our case is smaller than in other primates and due to our diet would waste much less energy). However, some of those human brain features and numbers, when not inconsistent, only beat marginally the ones from other species. Additionally the empirical support of the original “expensive-tissue hypothesis” has been contradictory. Therefore, leaving again unsubstantiated two scheming questions: why we have such extraordinary cognitive abilities? And how did the brain of the genus Homo evolutionary distance itself from the rest of its relatives the primates?
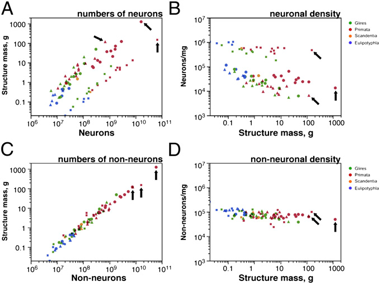
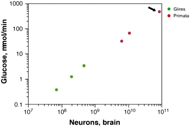
Facing the first question some years ago, Suzana Herculano-Houzel depicted a slightly different scenario about what makes different the human brain besides being very costly in terms of energy1. Taking into account that mammalian orders do not necessarily share the same brain-building plan; considering that brain size does not approach the amount of neurons; and after further and thorough quantification of numbers of neurons in the different anatomic parts of the brain of several orders of vertebrates including humans, she showed that the human brain could be just a scaled-up primate brain. Meaning that the human brain shares the same cellular basic schema and cell scaling rulesNote1 than the primate brain but it has way more neurons and non-neurons (in a ratio 1:1) than any other primate (Fig.1), thus it is the biggest. Being the biggest, it has the highest energy expenditure among primates due to the fact of a constant metabolic cost per neuron without regard of cell size across species (Fig.2). For example, following the appropriated cellular scaling rules for mice, a imaginary 1,5kg brain from mouse of would have 12 billion neurons wasting seven times less energy than the similar sized human brain with up to 86 billion neurons. This paper also points out that the limited data about synaptic densities suggest a number of synapses proportional to the size of the brain. Therefore, the significantly higher number of neurons in the human brain, which is the largest known to date, it is proposed as putative reason for our superior cognitive abilities.
Probably this enormous number of neurons is only the tip of the iceberg of what differentiates our brains from other primates. Important differences at molecular level could be expected as an emergent phenomenon beyond the genome divergence and despite the constant metabolic rates per neuron across the species. The most recent clue about that can be find in Bozek´s paper early last year2. This work shed a little more light on brain differences among species. It also faces the second question about proposing a trade-off between brain and muscle to explain how the human brain evolutionary diverged from the primate brain. By comparing metaboliteNote2 profiles of various tissues from mice, monkeys, chimpanzees and humans, they realized that muscle and brain metabolomes in humans differ more that expected by genetic distance.
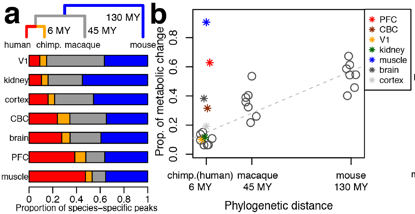
They studied metabolite concentrations in brain grey matter, prefrontal cortex (PFC), primary visual cortex (V1), cerebellar cortex (CBC), kidney cortex and skeletal muscle. It was found that in mice, macaques and chimpanzees the proportion of specie-specific metabolites in all those tissues diverge following the phylogenetic distances. In contrast, in human brain, prefrontal cortex and skeletal muscle the differences are from 4 to 8-fold bigger than expected by genetic distance (Fig.3). Indicating some kind of accelerated metabolome evolution in the gender Homo.
To rule out if the divergence observed in humans was due to our live stile and nutrition, they repeated those metabolite measurements in macaques exposed for a month to human life stile; and also compared the muscular strength of macaques, chimpanzees and humans (some of them athletes). The effect of the human live stile in the macaques´ metabolome was really small but detectable as an increase of human-specific metabolites to 3% of all human-specific metabolic changes identified across all those tissues. But the human pulling-strength/weight ratio was in any case away lower than in chimpanzees (even without obvious muscle fibre-type composition differences) and in average almost two-fold less compared with macaques. Thus, they conclude that thought the human live stile could be responsible of part of those metabolic differences it is unlikely explanation for the fast metabolic divergence observed in human brain and muscle but not in the other tissues tested. Moreover, these metabolic changes seem to affect mainly neural and energy metabolism pathways, which is in agreement with our superior cognitive abilities but lower muscular performance. All that opens a plausible picture where the energetically expensive human brain has been able to evolve due to a less powerful but also more sparing muscle.
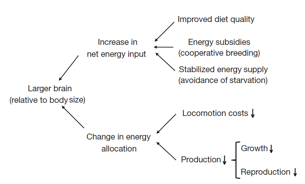
Certainly the proposed scenario for the brain evolution in humans is attractive because it provides an interesting set of data complementing, but not closing, the so-called expensive-brain framework 3Following the present framework, based in many different observations, the acquisition of a relative large brain would rise from being able to get more energy to feed it. The “expensive-tissue hypothesis” has being distracted in favor of the latter one, which argues as more feasible to obtain more energy exploiting several pathways for increasing the energy intake and/or saving energy more efficiently (Fig.4). Importantly for humans, having a basal metabolic rate bigger than expected for a primate of our size and given that visceral organs do not show consistent trade-offs, an energy-sparing muscle would be a good solution to allocate more energy in the brain. Of course, other anatomical adaptations (like bipedalism) or cultural developments (like cooking) would add to explain our larger brain on regard of energy expenses, but what was first is going to be difficult to discern like in the Chicken-and-egg problem. For the moment, it seems that the nature chose to make in humans what the old saying says: “think more to work less”. Those metabolomic discrepancies when comparing some tissues from apes and humans point out to an exceptional evolutionary divergence of muscle and brain but do not explain mechanistically these differences in strength and cognition. Therefore, more comparative studies about composition and behavior at cellular level among primate species would help to draw more accurate conclusions on how and why human brain became with such skills even sharing much of its genome with its closest primate relatives.
Notes:
1) Neuronal scaling rules is the ratio between the total number of of cells (neurons and non-neurons) and the size of the diferent brain anatomic parts (the cerebral cortex, cerebellum, and other structures). Here, to estimate the number of cells, the brain or its parts are completely fractionated preserving only the cell nuclei in suspension independently of brain volume.
2) Metabolites are small organic molecules (with a molecular weigt usually inferior to 1,5 kDa) with a wide range of functions in biochemical reactions and structures. Examples of this compounds are aminoacids, nucleotids, and lipids, pigments, chemical energy transports, neurotransmitters, siganlig molecules…
Metabolite concentrations are indicator of physiological state of tissues and cells.
References
- Herculano-Houzel, S. The remarkable, yet not extraordinary, human brain as a scaled-up primate brain and its associated cost. Proc. Natl. Acad. Sci. U. S. A.109 Suppl , 10661–8 (2012). ↩
- Bozek K., Zheng Yan, Xiling Liu, Jieyi Xiong, Masahiro Sugimoto, Masaru Tomita, Svante Pääbo, Raik Pieszek, Chet C. Sherwood & Patrick R. Hof & (2014). Exceptional Evolutionary Divergence of Human Muscle and Brain Metabolomes Parallels Human Cognitive and Physical Uniqueness, PLoS Biology, 12 (5) e1001871. DOI: http://dx.doi.org/10.1371/journal.pbio.1001871 ↩
- Navarrete, A., van Schaik, C. P. & Isler, K. Energetics and the evolution of human brain size. Nature 480, 91–3 (2011). ↩