How is chromatin structured?
How is chromatin structured?

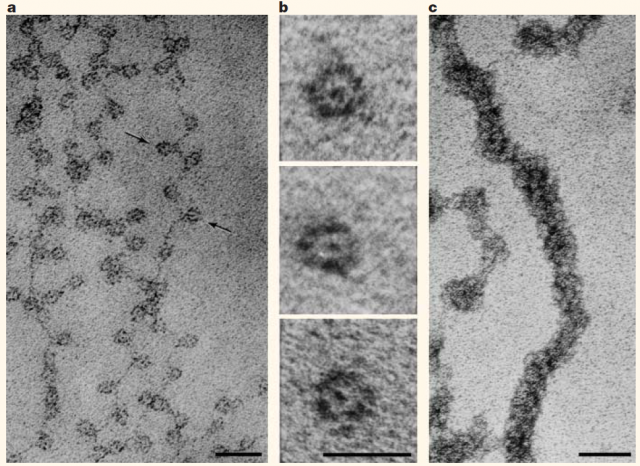
Almost every one of our body cells bears in its nucleus about 2 meters of DNA containing the genes that shape our being. All that, roughly 20.000 protein-coding genes, regulatory and unknown-function sequences, tightly packed inside a structure that has a volume of only a few cubic micrometres. How this huge amount of material is organized in such a small space and continues executing well its function is a puzzle whose solution began to appear in the mid-twentieth century with the works that led to Watson and Crick’s double helix model of DNA. Right afterwards, in the seventies, Ada and Don Olins and Christopher Woodcock observed 1 the so-called “beads on a string” looking at in vitro chromatin preparations with transmitted electron microscopes (Figure 1). Almost at the same time, Roger Kornberg determined that chromatin (DNA plus accompanying proteins like histones) was formed by a repeated unit of DNA and Histone complexes. From there, the Nucleosome as a subunit of chromatin architecture was proposed and confirmed.
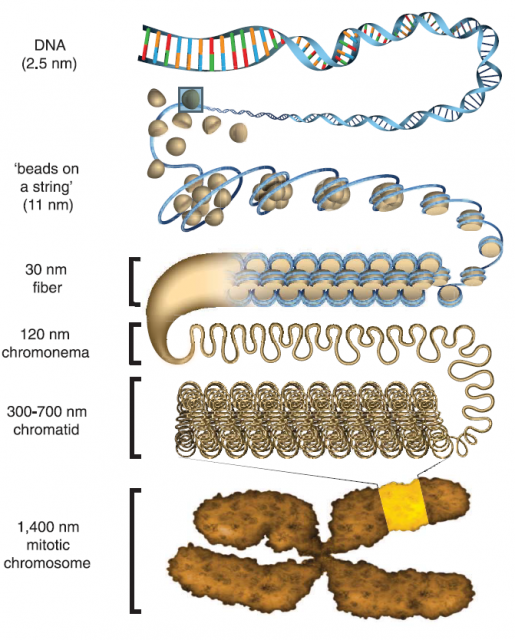
After finding the nucleosome, the work on chromatin structure performed during the following three decades was mainly based on X-ray crystallography and transmitted electron microscopy studies of purified DNA and Histones or permeabilized cells and nuclei. The early findings were summarized and simplified in the so-called hierarchical model of chromatin organization (Figure 2). This model shows that DNA-nucleosome fibres from about 11nm wide fold stepwise into higher order fibres within 30 to 700 nm. Organizing in this way mitotic chromosomes during mitosis or chromosome territories in interphase, as we already showed here some years ago.
The hierarchical structure of chromatin seemed at the very beginning a reasonable system for organizing such a hubbub of DNA. However, it has been long feared that at least part of the observed structures could be artefacts generated during the experimental preparations of chromatin: on one hand, making the chromatin structures visible for transmitted electron microscopy required to extract from cell samples other nuclear components via processes of permeabilization and fixing, which could affect the native structure. Otherwise, the required contrast‐enhancing agents (like osmium tetroxide) with low target selectivity would bind also nearby protein complexes hindering individual chromatin fibres. On the other hand, in vitro chromatin preparations of reconstituted nucleosomes starting from purified DNA and Histones were good simple models those days but quite far from the natural state of chromatin.
The suspicion about the wide existence of chromatin fibres larger than 30nm in living cells should probably arise in the late 80s, after the first cryoelectron microscopes. Their advantage respect the canonical transmission electron microscopes was allowing to observe samples without staining or fixing, just cryofreezing, which keeps better the native structure of the sample. When cryoelectron microscopy was applied for studying chromatin structure in cell samples, the only fibres seen so far were those close to 11 nanometres. Nerveless, cryoelectron microscopy has a small drawback: though cryofreezing generates enough contrast for observing many structures, the contrast is still quite low for chromatin, which makes difficult to study the chromatin structure in deep and with enough resolution.
Trying to overcome all these limitations, they used different and more advanced developments and variations of electron microscopy. For example, electron spectroscopy image provided high contrast and high-resolution images from chromatin fibres in cell samples without using additional contrast agents. In addition, it could be combined with electron microscopy tomography what allows to gain 3D information. With those new tools, few works also failed in seeing fibres in the range from 30 to 700nm. However, although they could not afford to study a high number of samples, they finally rose serious concerns about the validly of the hierarchy model for chromatin organization, which would need the more widespread presence of those higher order fibres.
Now the evidence accumulated during last decades sums up the work from Ou et. al., published 2 last month in Science. Ou and co-workers have developed a staining protocol for electron microscopy specific for chromatin fibres that seemingly increases the contrast and resolution quite beyond the previous technics. All that without the need of extract from the cells other nuclear components, just using a fixation protocol preserves the native structure of cells while generates enough contrast. Then, they have developed an automated analysis pipeline able to quantitate sizes of chromatin fibres in hundreds of 3D datasets acquired using electron microscopy tomography. All this apparently allowed them extensive quantitation of chromatin structure.
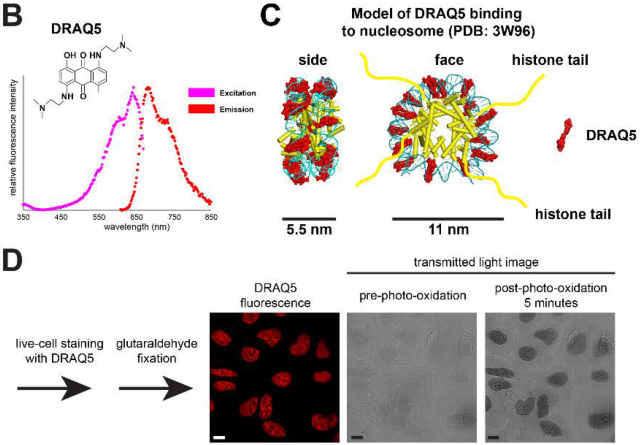
The funny thing in this history is that the key contrast agent that they use in this process is nothing else than a fluorescent molecule called DRAQ5 used during years for staining chromatin in optic microscopy. If a cell sample stained with this molecule is illuminated with light at 646nm, only DRAQ5 molecules binding specifically DNA will emit fluorescent light at 697nm. However, if DRAQ5 is illuminated with shorter wavelengths (e.g. 610nm during few minutes) it suffers photo-oxidation leading to the generation of reactive oxygen species that locally catalyze polymerization of diaminobenzidine on the surface of fluorescently labelled DNA. Later on, this layer of diaminobenzidine is stained with osmium tetroxide making chromatin visible under the electron microscope (Figure 3) (Tech Note1).
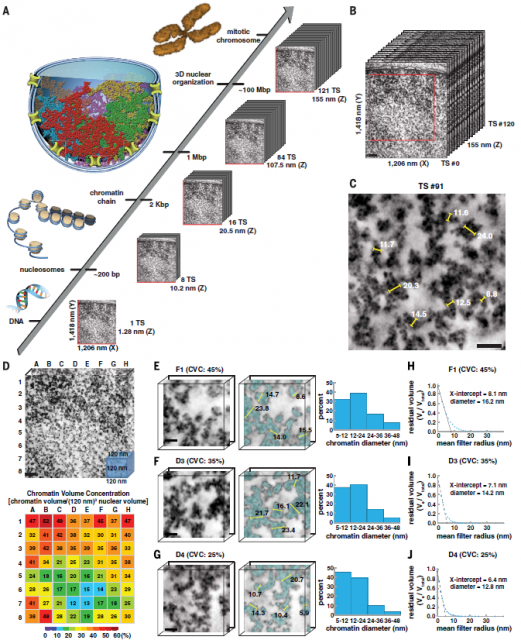
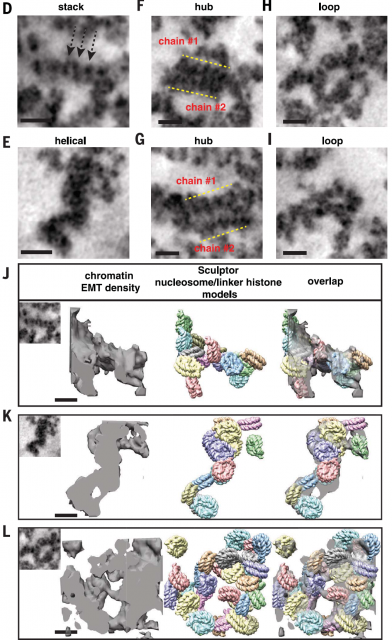
Afterwards, shape and size of chromatin fibres of hundreds of 3D datasets acquired using electron microscopy tomography were analyzed using Image analysis techniques. Finding out that the existence of chromatin fibres larger than 30nm was marginal in either interphase or mitotic chromatin in cells that, after sample preparation, presumably keep a fairly intact internal structure. (Figure 4). In fact, the majority of fibres seemingly have a diameter varying from 5 to 24nm with an average diameter of 14nm, which would reflect more a huge heterogeneity of nucleosome arrangements (Figure 5) than a well-organized hierarchical structure. Additionally, they show that interphase heterochromatin (regions of closed, denser and transcriptionally inactive chromatin) or mitotic chromosomes are characterized by a higher density of disordered fibres with an average diameter of 14nm while fibres wider than 30 are scarce. However, the authors observe a considerable amount of higher order fibres with more than 40nm of diameter if they follow former protocols of sample preparation for electron microscopy.
I still remember those classes in high school where they explained to us the structure adopted by chromatin in the nuclei of our cells. It seemed a small solid piece of knowledge: a hierarchical bottom-to-top organization of chromatin fibres was making rational sense. A bit later, already in the college, that simplistic model became something more complicated; the experimental evidence did not totally agree with it. Now, this new work adds strong support to the previous evidence and brings a valuable tool to do more extensive research in additional cell lines (in this work they use only two human cell lines) and different growing conditions. That will be needed in order to see whether the higher order fivers are only minor chromatin arranges or show up just under certain physiological environments or cell types. A low number of fibres larger than 30nm explains better the high dynamicity observed on living chromatin. In addition, the extremely fast changes in density and structure of the nuclear content through the cell cycle conciliate better with a flexible substrate than with a rigid structure. Therefore, and for the moment, I would broadly summarise saying that, in living cells, chromosome domains are mainly formed by disordered chains of nucleosomes adopting heterogeneous arrangements whose structure and density are modulated locally as a way of regulation. The packings that generate fibres thicker of 30nm would still exist in living cells but they are probably relegated to some function where a more rigid structure of the chromatin is necessary. No doubt, solving completely the chromatin puzzle will take us more than a while, however being able to see the pieces is going to help a lot.
Tech Note1: Living cells are directly stained with DRAQ5 and then rapidly fixed with glutaraldehyde for preserving the molecular structure and avoid DRAQ5 diffusion. Later the sample is incubated with diaminobenzidine and once its polymerization is induced by light, the samples are treated with osmium tetroxide that stains diaminobenzidine polymers with high affinity (Figure 3D). At the same time, osmium tetroxide will stain membranes and other protein complexes not specifically; however, the presence of polymers of diaminobenzidine on DNA will enhance the osmium tetroxide deposition there highlighting chromatin structures over the proteinaceous background.
References
- Donald E. Olins and Ada L. Olins. (2003). Chromatin history: our view from the bridge. Nature Reviews. doi: 10.1038/nrm1225 ↩
- Ou, H.D. et al. (2017). ChromEMT: Visualizing 3D chromatin structure and compaction in interphase and mitotic cells. 357. Science. doi: 10.1126/science.aag0025 ↩