How light interacts with a bunch of marbles
How light interacts with a bunch of marbles
“Photonic crystals” is the name that was given to periodic arrangements of materials with different refractive indexes. This name derives from the analogy between the behavior of photons in these materials and the one of electrons in the periodic structure formed by atoms in an actual crystal. The technological side of the analogy suggests a number of revolutionary applications for photonics, in the same way as electronics did in past decades.
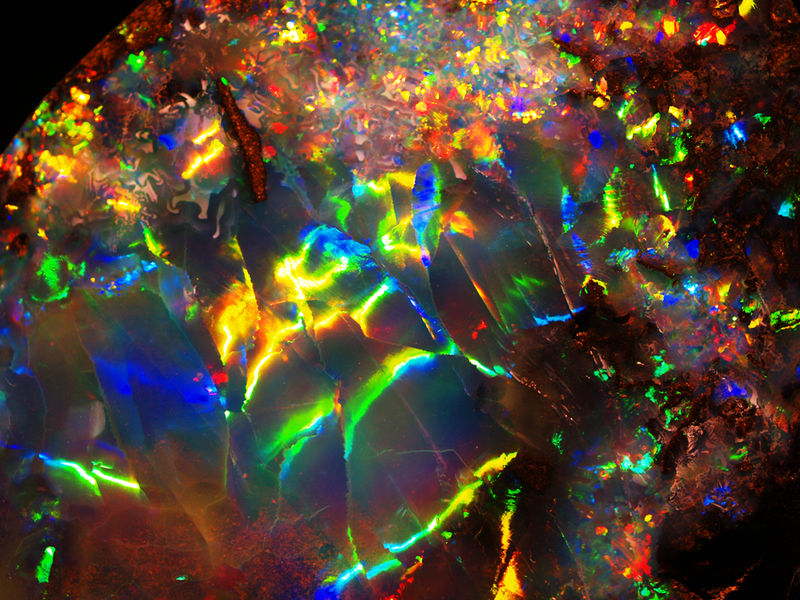
One of the many ways of building a photonic crystal is by packing marbles; that is to build a periodic arrangement of glass spheres, a structure naturally occurring in the gemstones called opals (see fig 1). The surprising way of shining of these precious gems, changing colors as you move them, is a visible demonstration of the wonderful and complex interaction of light with this kind of systems.
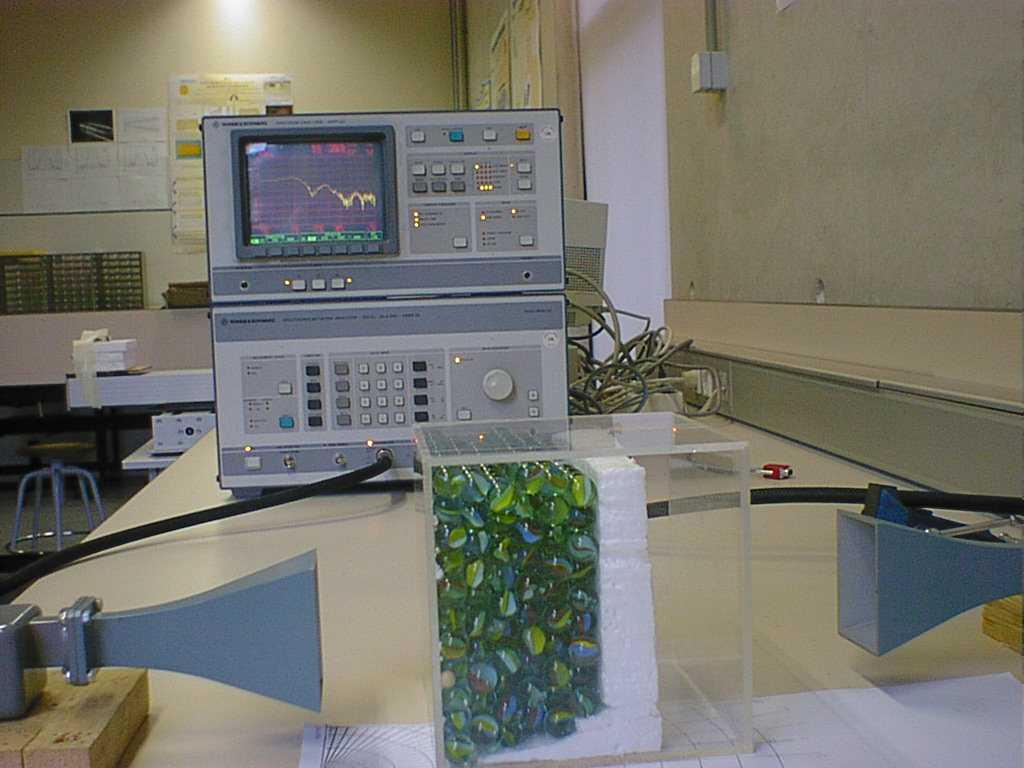
Maxwell equations, those describing electrodynamics classically, are not tied to any particular size. This means that results obtained for the interaction or light with an object can be readily extrapolated to a bigger one with the correspondingly larger wavelength light. This allows approaching the study of opal like photonic crystals by “inflating” them until macroscopic sizes and measuring their interaction with microwaves instead of visible light. Figure 2 1 shows such experimental system, where a sample of six layers of marbles is placed between two microwave horn antennas connected to a microwave spectrometer (or network analyzer).
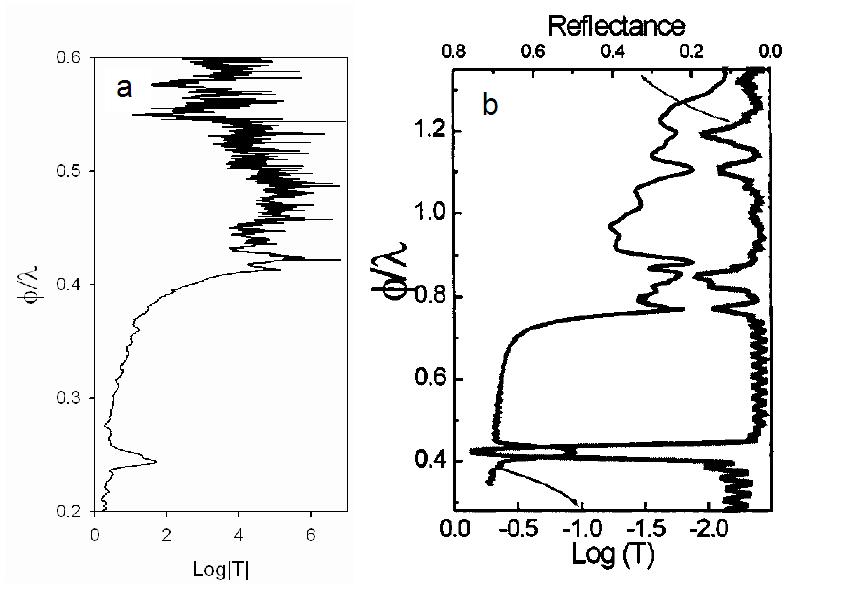
Two transmission spectra of samples of several layers of spheres are presented in figure 3. Plot (a), in the left was taken in the microwave domain, with glass spheres of 9mm 2 while plot (b), in the right, corresponds to the optic domain, with latex spheres of 690 nm 3. Figure 3b also includes the reflectance. In both plots the vertical axis represents the light frequency normalized to the sphere diameter (Φ), being Φ/λ the dimensionless magnitude describing the radiation. A value of 1 means light with a wavelength equal to the sphere diameter, 0.5 that just half wavelength fits in a sphere diameter and so on. The horizontal axis represents the amount of light that traverses through the sample reaching the detector in the other side; zero means complete transparency and bigger numbers less transmission.
As expected, transmission spectra in both cases look alike. It contains two main features a defined dip at lower values of Φ/λ (0,35 – 0,4) and a significant loss of transmission starting at higher values (0,6 – 0,8). The difference in the precise frequency values of these features is due to the different refractive index of the spheres used in the experiments, glass and latex. Let us discuss the origin of these two features.

The well defined dip in those spectra has a simple physical origin; it is due to the Bragg diffraction caused by the planes of spheres. Let’s imagine that each layer of spheres is reduced to a plane; then the structure turns into a piling of planes (reflectors) spaced a certain distance d (see fig 4). The light reflected from a deeper plane travels a longer way (2d sinθ). For certain wavelengths (λ) this extra way will match its value (or any multiple of it) leading to a situation where the light reflected by each plane comes out in phase, giving rise to constructive interference and an intense reflection. For these values of λ all light is completely reflected. Working out the calculations it is easy to demonstrate that this dip corresponds to this value. When tilting a piece of opal, we are changing the angle θ, and therefore the extra way between sphere planes and consequently the wavelength of the intense reflection. That is why it shines in different colors when moved.
The huge loss of transmission observed in figure 3 at higher frequencies (Φ/λ ≈ 0,6 – 0,8) has a more complex explanation. It is caused by the resonance of the light inside each sphere. The scattering of light by a sphere was analytically studied at the beginning of the XX century by Gustav Mie, Peter Debye and Konrad Lorentz. Mie solved the Maxwell equations for spherical symmetry finding that, for wavelength values of the order of magnitude of the sphere size, there were resonant values. These resonances that Mie found are energy levels of the photons inside the spheres analogous to those electrons have in atoms. Of course these are not identical phenomena, the main difference lies in the stability of the states; while electrons in the atomic potential well rest indefinitely, photons inside the spheres have a limited lifetime. When many spheres are forming a crystal the photonic states interact with each other forming collective states of the crystals. The light trapped in these states is unable to travel trough the material and, therefore, is not detected in the other side. That is what is observed as the high frequency band of figure 3.
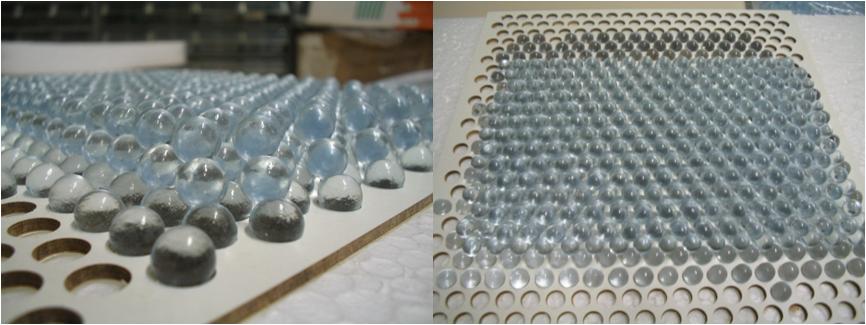
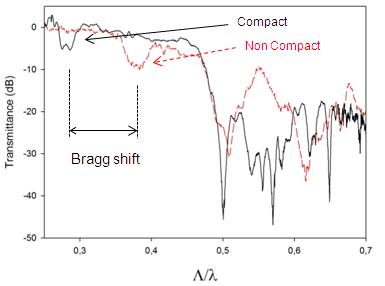
In order to test this explanation of the characteristics of transmission spectra we designed an experiment based in “non compact” sample of several layers of spheres 4. With the aid of a wooden template, 8mm diameter spheres are placed at 1mm from each other (see Fig 5). Successive layers are placed on top of the first, building a “stretched” sample, shorter in the vertical direction (planes are more intertwined than in the compact case) and wider in the perpendicular plane (as the spheres are not touching each other). The transmission spectra measured for this sample is presented in figure 6 together with the one taken from a compact sample of similar characteristics. It can be seen that the dip corresponding to Brag diffraction suffer a significant frequency shift. The geometrical calculation of how closer the centers of the spheres become in the vertical direction accounts perfectly for this shift, making clear that the dip in the spectrum is due to Bragg reflection. On the other hand, the higher frequency band remains almost unchanged; this is consistent with the fact that resonance states of the spheres remain almost unaltered by this slight repositioning. Therefore this simple experiment strongly supports the abovementioned explanation for the main features of the transmission spectra of opal like structures.
Bragg diffraction is widely used in optics, for example in the design of antireflective coatings for glasses. Much more recently the resonant states of sphere layers are being applied to ease the coupling of light inside and outside a material; particularly promising is the study to improve the efficiency of photovoltaic devices 5. It is amazing to see how the scientific study of a bunch of marbles could end up in relevant applications.
References
- A. Gastón, M. Beruete, F. Meseguer, M. Sorolla, and J. Sevilla, “Strong microwave second order rejection band in opal-like structures,” Microwave and Optical Technology Letters, vol. 47, no. 5, pp. 472–475, 2005 ↩
- A. Andueza, M. Sáenz, R. Echeverria, P. Morales, and J. Sevilla, “Photonic band effects in three dimensional lattices of macroscopic-sized dielectric spheres derived from microwave transmission spectroscopy,” Optical and quantum electronics, vol. 40, no. 13, pp. 1043–1051, 2008 ↩
- H. Mı́guez, V. Kitaev, and G. a. Ozin, “Band spectroscopy of colloidal photonic crystal films,” Applied Physics Letters, vol. 84, no. 8, p. 1239, 2004 ↩
- A. Andueza, R. Echeverría, P. Morales, and J. Sevilla, “Transmission spectra changes produced by decreasing compactness of opal-like structures,” Journal of Applied Physics, vol. 105, no. 2, p. 24910, 2009 ↩
- J. Grandidier, D. M. Callahan, J. N. Munday, and H. A. Atwater, “Enhancement Using Whispering Gallery Modes of Dielectric Nanospheres,” IEEE Jorunal of Photovoltaics, pp. 1–6, 2011 ↩
1 comment
Interesting. As a quantum physicist I would like to analyze how a single photon interacts with this kind of materials.