Mapping the explosion of Cassiopeia A
Mapping the explosion of Cassiopeia A
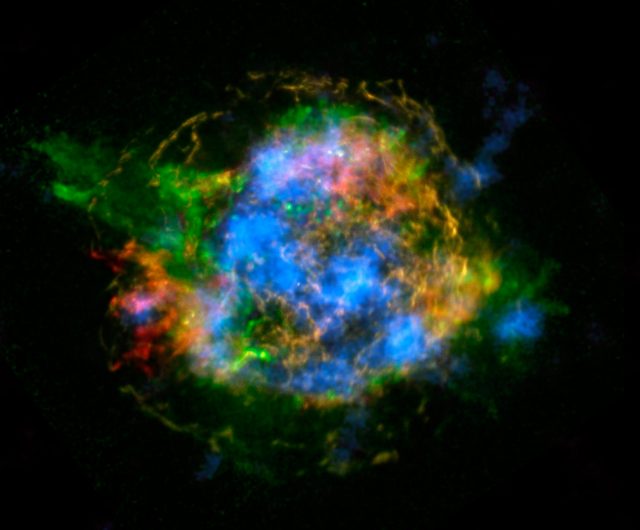
Supernovae are one of the most fascinating events in stellar astrophysics. Most stars suffer explosions at some point of their last days but the most massive ones explode releasing incredible amounts of energy and rivaling in brightness with the rest of the galaxy they live in. What they leave behind is hydrogen enriched with materials heavier than iron that cannot be produced otherwise in the Universe. From this renewed interstellar medium new stars and planets are formed again in a cycle of death and life that has been revised many times. Among supernovae, Cassiopeia A (see Figure 1) is possibly one of the most studied ones, being not only the brightest extrasolar radio source in the sky but also the youngest supernova remnant in our Galaxy. Now, a recent work 1 has provided a surprising insight on how the star exploded by mapping the distribution of a radioactive element in the remnant.
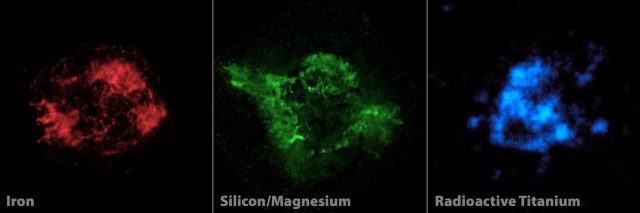
The work by Grefenstette and collaborators is based on a fortnight of X-ray observations using NuSTAR (NUclear Spectroscopic Telescope ARray), a space based telescope operating in the 5-80 keV range. The Cass A supernova remnant shows two emission lines associated with 44Ti which can be mapped with the astonishing capabilities of the space observatory (see Figure 2). The observed distribution of this radioactive element can be compared with the distribution of other elements such as Fe or Mg/Si that had been previously studied in other works. The distribution is clumpy and somewhat extended in the direction of a jet seen at other wavelengths. But it does not follow them exactly. In the case of the Fe distribution this is particularly intriguing since it had been thought that 44Ti is produced in the same processes as 56Ni, which later decays into 56Co and lately to 56Fe 2. This seems not to be the case. Analyzing the distribution of Titanium and comparing with the age and expansion velocity of the supernova, it turns out that this element is contained in the unshocked interior of the supernova. This means that we are indeed mapping the shape of the star before the explosion by mapping Titanium.
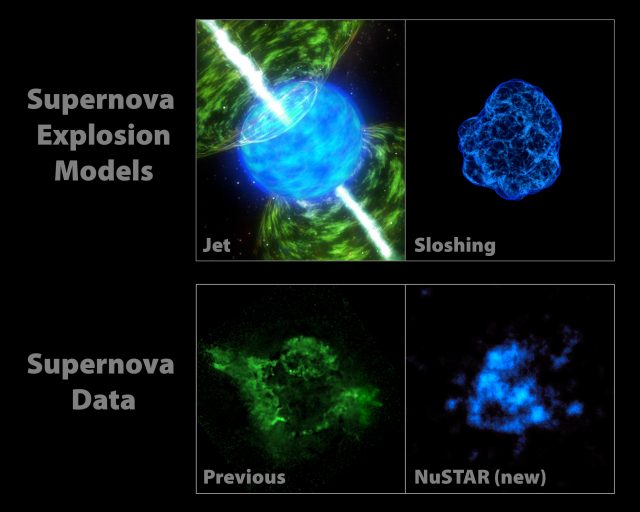
Next step for Grefenstette and collaborators was to try and modelize the spatial distribution of Ti and its correlation with Ni (mapped from Fe distribution as commented before). For doing so, they used two opposing models for the supernova explosion. The first one was for a fast-rotating star and the explosion forced to be dominated by a bi-polar jet reminding the jet-like structure observed in the Si/Mg distribution. The second one was assumed to be spherically symmetric. None of them was able to reproduce the observations. On the one hand, the inhomogeneities formed by the spherical model were far less than those observed. On the other hand, the bi-polar explosion was unable to reproduce the off-axis clumping of Ti distribution. It obviously seems that the real model should lie somewhere in between of such extreme cases. This intermediate model was nicknamed the sloshing star and numerical models are on their way but we still have to wait for results to come out. The sloshing would produce an uneven heating of the remaining material therefore reproducing what we have seen so far in Cass A. However, it also forces us to rethink the physics involved in supernova explosions.
Let’s rewind the history of this star. Sometime close to 1680 AD, a star at more than 11,000 light-years from Earth exploded. Even though it had to become quite bright as seen from our planet, we have no clear records of sightings as it happened with other historical supernovae. This has been a puzzle for a long time and there is still some debate on the nature and ultimate fate of the progenitor star. Much of this debate was settled when Oliver Krause and collaborators were able in 2008 to determine the type of supernova Cass A was3. This was done by analyzing the echoes of the light in the surrounding material, which reached us some 400 years later than the original light. It was possible to identify the explosion as a type IIb. In general terms, they happen in massive stars which lose much of its hydrogen envelope due to interactions with a binary companion and so the supernova explossion is called a core-collapse supernova.
So, all in all, what is the importance of the analysis of Cassiopeia A? Can it be explained arguing that it was a peculiar phenomenon? Or do we have to think of new models for our understanding supernova explosions? Whatever happens, this seems to be the kind of work which opens the door for many others to come. Better and more detailed spatial resolved observations of radioactive elements are required. Better and more sophisticated dynamical models of explosions are also needed. And this seems to be happening right now so, hopefully, we will surely see advances in this field in the next few years.
References
- Grefenstette B.W., Harrison F.A., Boggs S.E., Reynolds S.P., Fryer C.L., Madsen K.K., Wik D.R., Zoglauer A., Ellinger C.I. & Alexander D.M. & (2014). Asymmetries in core-collapse supernovae from maps of radioactive 44Ti in Cassiopeia A, Nature, 506 (7488) 339-342. DOI: 10.1038/nature12997 ↩
- Laming J.M. (2014). Astrophysics: Lopsided stellar death, Nature, 506 (7488) 298-299. DOI: 10.1038/506298a ↩
- O. Krause et al. (2008). The Cassiopeia A Supernova was of Type IIb. Science 320, 1195 – 1197. doi: 10.1126/science.1155788 ↩
4 comments
[…] Entre las supernovas Casiopea A es posiblemente una de las más estudiadas, seguramente por ser una de las fuentes de radio más brillantes del cielo pero tembién el resto de supernova más joven de la galaxia. Ahora un estudio […]
[…] [Leer la entrada completa en Mapping Ignorance] […]
[…] harrigarria eman du ikerketa berri batek. Xehetasunak Santiago Pérez Hoyosek ematen dizkigu Mapping the explosion of Cassiopeia A […]
[…] mappingignorance.org […]