Which catastrophes should be averted?
Which catastrophes should be averted?
“‘Is there no way,’ said I, ‘of escaping Charybdis, and at the same time
keeping Scylla off when she is trying to harm my men?’”
-Homer, The Odyssey
Conventional cost-benefit studies are based on marginal analysis. A decision to undertake a project should be made if, with respect to the actual situation, it provides more benefits than costs. In doing so, one is implicitly assuming that the project is small with respect to the size of the relevant economy as well as that there are no interactions with other projects. When these conditions are not met, we need different approaches. Let us see some examples.
1. The benefit of a project is 100 and the cost is 50, but the economy only has 30. Cost-benefit analysis says that it should be undertaken, but it is impossible to do so if there is no one from whom to borrow at least the extra 20 needed.
2. Accident A will reduce my future income to a half (from 120 to 60). Accident B will reduce it to a third (from 120 to 40). Taken each one in isolation, one will prevent A if the cost is less than 60 and B if the cost is less than 40. However, if both accidents may occur, and B comes first, the benefits from preventing A change: B has already reduced my income to 80, and A can only reduce it by another 40. If the cost to prevent A was 50, it is optimal to do it if the chance of B does not exist, but not if accident B occurs first.
The last example considers that accidents are certain and that the benefits and costs to avoid them compound linearly, but the problem persists if they do not add linearly, or if they are probabilistic in terms of occurrence, prevention, and timing.
3. Accidents A and B will occur with certainty next year. Each one alone will reduce my income by 50%. The two of them together reduces it by 75%. If my preferences towards risk are of a particular form (technically, if they exhibit constant relative risk aversion), I may find that the most I want to pay to avoid just one accident is 40% of my current income while for the two of them is 60%. Now, if to prevent one accident costs 35% of my income, at a first naïve glance it seems that I will prevent both (as 35 is smaller than 40), but one should notice that after preventing one of them, I will be willing to pay less than 40 to avoid the second one (because I have a smaller income after paying the cost). With the mentioned preferences, this willingness to pay is reduced to 33% (smaller than 40) and, therefore, the optimal option is to avert only one accident.
These examples show the difficulties of the analysis, difficulties that increase with the number of possible accidents. Martin and Pindyck (2015) 1 propose a general way to address the problem. First, they specify the nature of the accidents to concentrate on catastrophes faced by the whole society, like climate change, a virus spread or nuclear terrorism. Then, they model costs and benefits. For a given catastrophe, the benefits will be equated with the willingness to pay to avert it, a standard procedure in Economics, which is defined as the maximum fraction of consumption society would sacrifice to achieve this result. The corresponding costs will be the actual fraction of consumption that would have to be sacrificed, via a permanent consumption tax (t) to generate the revenue needed to avert the catastrophe. For example, Catastrophe 1 could be averted at the cost of paying (1–t1) forever (where consumption is set to be equal to one in the absence of any catastrophe). To avert catastrophes 1 and 2 the cost would be (1–t1)x(1–t2) forever, and so on.
With this way of modeling, the authors are able to provide their main result:
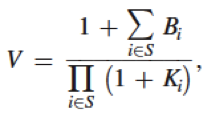
If the set of catastrophes is {1,2,…,N}, it is optimal to choose the subset S that maximizes the value V (call it utility) given by
where Bi and Ki are the benefit and the cost of averting catastrophe i, respectively. Notice that, in the formula, benefits add and costs multiply.
After this result, the authors can show how it works in several scenarios. For instance, the formula is greatly simplified when there are many small catastrophes. If they have more or less the same costs and benefits, the number of catastrophes to avert is given by
m*= 1/(log(1+K) – 1/B).
The most interesting examples are those where the optimal solution is counter-intuitive. For instance, consider the case that there are three catastrophes, one with a very favorable cost-benefit ratio, and the other two with a less favorable ratio. It would be tempting to say that one should first eliminate the first one and, then, compute whether it pays to avert the other two. However, it may be optimal to eliminate the last two and not the first.
The methodology is also extended for the situations where catastrophes can be partially averted, where policies to avert a catastrophe can help to avert a second one, and for projects that increase the likelihood of a bonanza (rather than decreasing the chances of a catastrophe.)
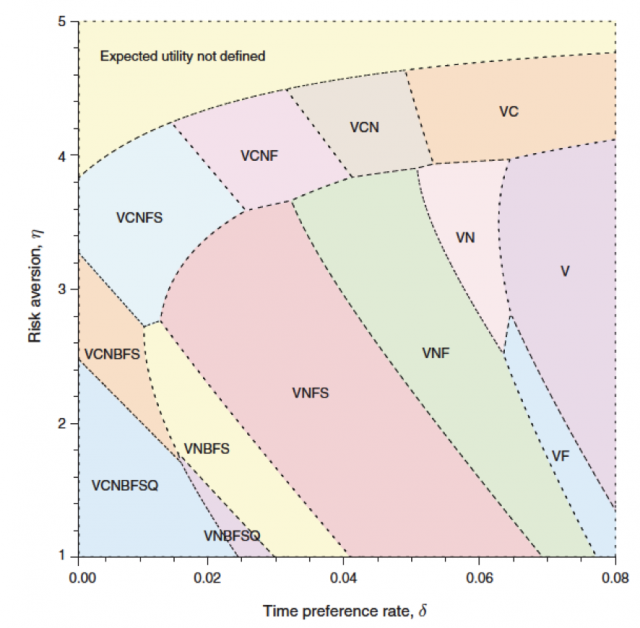
As a bonus, the authors show how the methodology may work with actual catastrophes. For that, they select the following seven: Mega-virus, Climate change, Nuclear terrorism, Bioterrorism, Floods, Storms, and Quakes. For each one of them, and when possible, they collect data from the literature to enter the appropriate parameters in the model. For instance, in the case of Mega-virus they take the case of the Spanish flu of 1918-1919, which infected 20% of the world’s population and killed 3-5%. With this reference, they take the average mortality rate of the next pandemic to be 3.5%, which they estimate is equivalent in welfare terms to a roughly 17.5% drop in consumption. This comes after using data on risk-of-death choices to have an estimate of the value of a statistical life (see, for instance, Martin and Pindyk, 2014 2; Viscusi, 1993 3 and Cropper and Sussman, 1990 4). The costs to avert this catastrophe (containment, the production of vaccines, etc.) are set at a 2% of global GDP as the best guess.
They proceed in this way with the rest of the catastrophes and, then, compute the optimal subset of catastrophes to be averted using their methodology for different parameter values in the utility function that indicate risk aversion and time preferences (patience). The results can be seen in Figure 1. Each area shows the subset of catastrophes that should be averted for the different combinations of risk aversion and patience.
References
- Martin, I.W.R., and Pindick, R. 2015. Averting Catastrophes: The Strange Economics of Scylla and Charybdis. American Economic Review 105(10), 2947–2985. DOI: 10.1257/aer.20140806 ↩
- Martin, I.W.R., and Pindick, R. 2014. Death and Destruction in the Economics of Catastrophes. Unpublished. ↩
- Viscusi, W. Kip. 1993. The Value of Risks to Life and Health. Journal of Economic Literature 31(4), 1912–46. ↩
- Cropper, M.L., and Sussman, F.G. 1990. Valuing Future Risks to Life. Journal of Environmental Economics and Management 19(2), 160–74. ↩
3 comments
[…] Imagina que las catástrofes naturales pudieran ser evitadas, pero que solo puedes invertir todos los recursos necesarios en evitar una. ¿Cómo decides que catástrofe evitar? Pues eso es lo que se pregunta José Luis Ferreira en Which catastrophes should […]
[…] El Análisis Coste-Beneficio de las Catástrofes: ¿Qué tipo de catástrofes deberíamos evitar? También en castellano: I & II […]
[…] Image source […]