The costs of going green
The costs of going green

A tax on carbon emissions is an efficient way to make firms and consumers internalize the environmental costs due to climate change. However, there are many other aspects to consider in a transition from a fossil-fueled economy to a cleaner one. In a past article we presented the case for subsidies on research to develop better and cheaper clean technology. In the present post we summarize a recent article published in the Journal of Economic Perspectives (Gillingham and Stock, 2018 1), where the authors analyze the long-term consequences of investments in different technologies and their implications for calculating the cost of reducing greenhouse gas emissions. The article is completed with two study cases.
Static costs
The first approach at analyzing the costs of reducing emissions concentrates on static costs using available technology, and ignoring spillovers. These static costs are an element in creating what is called a marginal abatement cost curve, which plots out the marginal costs of achieving a cumulative level of emissions abatement. The best-known example is the McKinsey curve (McKinsey & Company, 2009 2), which is constructed using engineering estimates of the cost of implementing new technologies or other measures.
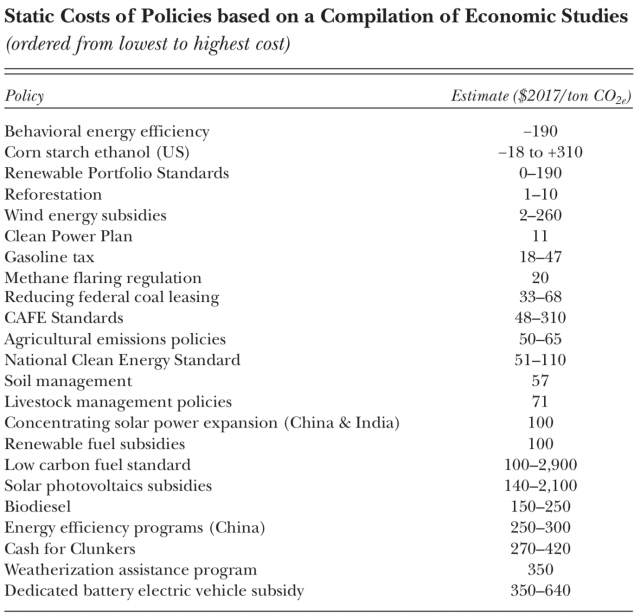
A striking feature of the McKinsey curve is that some interventions have negative costs: that is, emissions can be reduced, and money saved, at the same time. Economists are skeptical of these free lunch estimates, as they would indicate that consumers or firms are not taking their individually optimal decisions. An alternative explanation is that the engineering estimates do not include behavioral considerations that economists do consider. Think, for instance, on the effect of turning the heat up because it becomes cheaper after weatherization of the house. For this reason, and because the McKinsey curve has become out dated, the first thing Gillingham and Stock do is to provide a new curve with the most recent estimates from the economics and trade literatures, supplemented by their own calculations. To put some perspective on the meaning of the data, under the Obama administration the US government estimated the social cost of carbon to be $46 per metric ton of CO2, a figure in the lower end of the range of the academic literature. The data are shown in Table 1.
The wide range of costs for some interventions is due to the specificities of local conditions. For instance, the costs of emissions reduction via wind power depends on weather conditions and also on the alternative electricity production technology it replaces. Of course, the way different methodologies address the uncertainty also causes different estimates. Another feature is that some negative cost in the McKinsey curve now are positive. For example, in a randomized controlled trial, Fowlie et al. (2018) 3 found that the actual costs of the weatherization exceeded the savings. Some of the interventions have negative or very low costs, like the Clean Power Plan for emissions standards in the power sector by the Obama’s administration. The plan was particularly efficient because of its size and because some of the reduction required switching production to existing cleaner plants, and because it allowed interstate trading of emissions permits. Among the costly interventions are the biodiesel subsidies and the Cash for Clunkers program to exchange old vehicles for more efficient new ones.
Dynamic costs
There are at least four reasons why it is necessary to include the dynamic costs in the analysis.
- Many of the low-carbon technologies are nascent, and there could be substantial gains in production efficiency as more units are produced due to learning by doing and scale economies. To the extent that such gains are only partially appropriable by the firm, an expenditure today provides a positive externality that reduces costs in the future.
- A related externality arises from research and development spillovers because research results are only partially appropriable.
- Network externalities. For example, purchases of electric vehicles today will, on the margin, stimulate demand for charging stations, which once installed will lower the effective cost for future potential purchasers of electric vehicles.
- Path dependency. Energy investments typically have substantial irreversible components, which in general implies state dependence so that the dynamically optimal path may differ from a sequence of myopic optimizations each chosen at a point in time. This potential for lock-in is at the heart of the debate about the merits of natural gas as a bridge fuel towards decarbonizing the power sector, in which renewable proponents argue that natural gas is cheaper only if one optimizes myopically and fails to recognize that the power sector will eventually need to be decarbonized.
Not all dynamic costs lower the initial static costs. For example, for the nuclear option the costs have increased with time (David and Hausman, 2016 4.)
Case study 1: Solar Panels
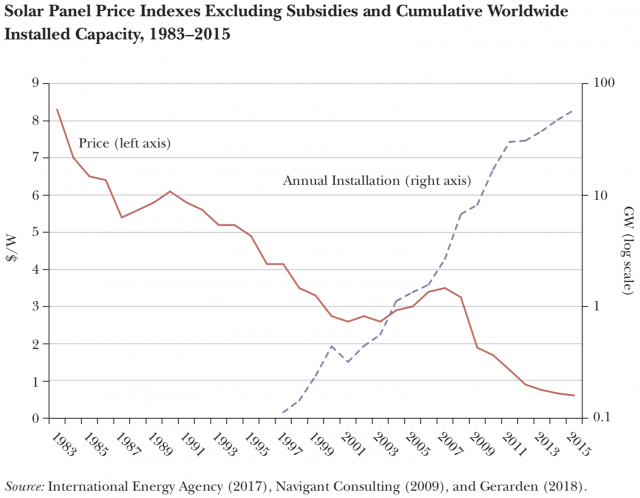
Figure 1 shows the price excluding subsidies and cumulative installed capacity of photovoltaic solar panels. There are two distinct features in this figure. First, the constant, rapid increase in installed capacity during the present century and, second, the fact that the accompanying drastic reduction in price came later, after 2007. Both the timing shown in Figure 1 and recent research suggests that the early push in demand, stimulated by deep government subsidies, did in fact help to drive down the price of solar panels. One channel is that current subsidies may encourage firms to innovate to reduce their future costs. Gerarden (2018) 5 estimates that this induced innovation effect, which does not include learning-by-doing, contributed to the decline in solar array prices and increased the long-run external social benefits from global government subsidies to solar adoption by at least 22 percent. In another work, Nemet (2006) 6 decomposes the reduction in cost into the manufacturing plant size, module efficiency, and cost of silicon, finding that between 1980 and 2001, economies of scale from larger manufacturing plant sizes accounted for 43 percent of the cost reduction. Most of the remaining cost reduction could be attributed to improvements in module efficiency due to research and development investment. Although in many cases the economies of scale can be appropriated by the firms as they scale up, in the absence of a carbon price, the demand for solar panels will be less than it would be were there a carbon price.
Case Study 2: Electric Vehicles
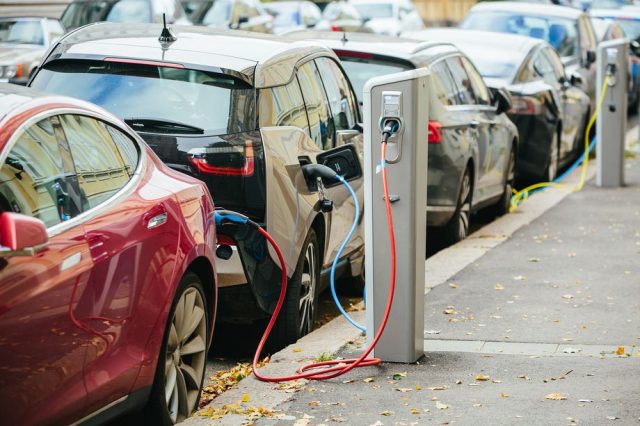
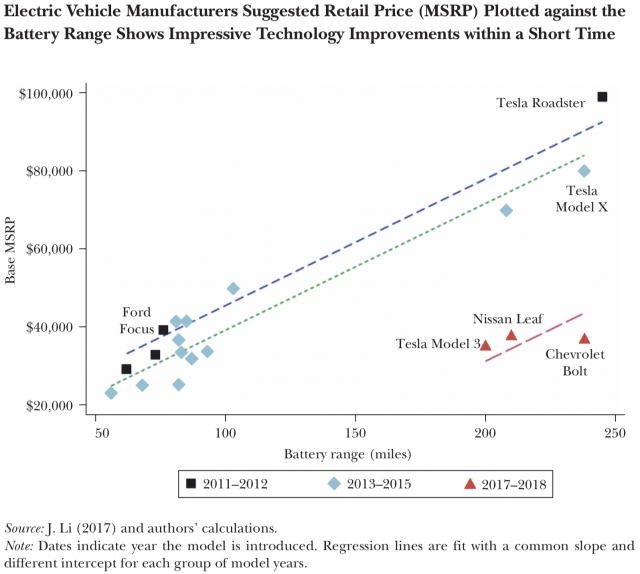
Electric vehicles share many of the characteristics of solar panels, including the sharp reduction in prices in recent years and the government demand-pull subsidy programs. Still, when life-cycle considerations are included, on average electric vehicles currently only slightly reduce emissions relative to gasoline-powered ones (Archsmith et al., 2015 7). These static calculations ignore the fact that the grid is becoming cleaner, however there are no studies including the dynamic costs, perhaps because the cost declines and sales growth are so recent. The best policies seem to be the ones targeting at the network externalities, like facilitating the opening of charging stations and reaching a critical mass in the market.
References
- Gillingham, K., and Stock J. H. 2018. The Cost of Reducing Greenhouse Gas Emissions. Journal of Economic Perspectives 32:4, 53–72. ↩
- McKinsey & Company. 2009. Pathways to a Low-Carbon Economy: Version 2 of the Global Greenhouse Gas Abatement Cost Curve. Report. ↩
- Fowlie, M.; Greenstone, M., and Wolfram, C. 2018. Do Energy Efficiency Investments Deliver? Evidence from the Weatherization Assistance Program. Quarterly Journal of Economics 133:3, 1597–1644. ↩
- Davis, L.W., and Hausman, C. 2016. Market Impacts of a Nuclear Power Plant Closure. American Economic Journal: Applied Economics 8:2, 92–122. ↩
- Gerarden, T. 2018. Demanding Innovation: The Impact of Consumer Subsidies on Solar Panel Production Costs. Unpublished paper. ↩
- Nemet, G. F. 2006. Beyond the Learning Curve: Factors Influencing Cost Reductions in Photovoltaics. Energy Policy 34:17, 3218–32. ↩
- Archsmith, J.; Kendall, A., and Rapson, D. 2015. From Cradle to Junkyard: Assessing the Life Cycle Greenhouse Gas Benefits of Electric Vehicles. Research in Transportation Economics 52, 72–90. ↩
1 comment
[…] bakoitzaren kostua ezagutzea da, dena barne dutela. Jose Luis Ferreirak lantzen ditu aipatutakoak The costs of going green […]