The quest for the elementary motion detector in the fly
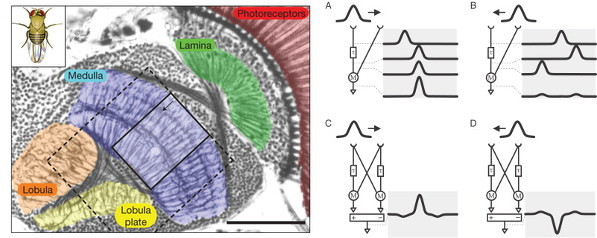
Cajal famously described the fly visual system as “stupendous, indeed disconcerting, and with no precedent in other animals”. By comparison, the vertebrate retina seemed “gross and deplorably simple”. Now we know that this simplicity is only apparent, but we can use the more clearly structured fly retina to help us study basic problems in visual science, such as motion detection. Many possible theoretical structures for a motion detector have been postulated in the fly. Those models (Fig 1) involve a comparison of the signal between neighboring points in space, with a time delay, and have been validated by the result of cleverly designed behavioural experiments, a sort of fly version of optical illusions. But to see how this is physically implemented by neural circuits —a decades old problem— we have to take a careful look at the structure of the fly visual system.
The fly eye is divided in small components, called ommatidia, each of them with their own lens and a small set of photoreceptors under it, two small ones that mediate colour and polarisation vision and six long photoreceptors for achromatic (grayscale) vision. The signals from all achromatic photoreceptors looking to the same point of the world —normally in six neighboring ommatidia— are then summed together into the same lamina cartridge, as we call each of the repeated neural circuits in the lamina (Fig1, green). L1 and L2 are the neurons of the achromatic pathway sending most of the connections to the medulla (Fig1, blue). They are roughly similar to the ON and OFF bipolar cells in the vertebrate retina, in that L1 codes preferably bright edges and L2 dark edges, and they lack sensitivity to motion. On the other hand, T4 and T5 (first described by Cajal), are though to convey motion sensitive information from the medulla to the lobula plate (Fig1, yellow). Therefore, the elementary motion detection circuits should lie in the medulla. The next step is to take a closer look at neurons there, and see how are they connected.
But connectomics, the goal of exhaustively mapping neurons and their connections is a very challenging task. It was in 1986, after 12 years of tedious work of finely slicing the animal and careful microscopic observations, when the first —almost— complete connectome, the one of Caenorhabditis elegans, was published. This small nematode has exactly 302 neurons and —at least— 7283 connections. However, reconstruction techniques are difficult and error prone; even in the simple C. elegans after decades of research, about 5% of the chemical synapses and an unknown number of gap junctions (a simpler type of connection between neurons much more difficult to spot under the microscope) have not been properly described 1. But despair not! A recent article illustrates what can you do when you know how neurons are connected, even when you are probably missing some of the connections.
Takemura et al. 2 published in Nature a connectome of the medulla of the small fruitfly Drosophila melanogaster. The fly medulla, like the lamina, is retinotopically organised, with neurons organised in columns receiving most inputs from a single lamina cartridge, and therefore mainly from only one point on the image. They described 379 neurons in a reference column and traced the connections across seven columns, finding about 8637 synaptic connections in total.
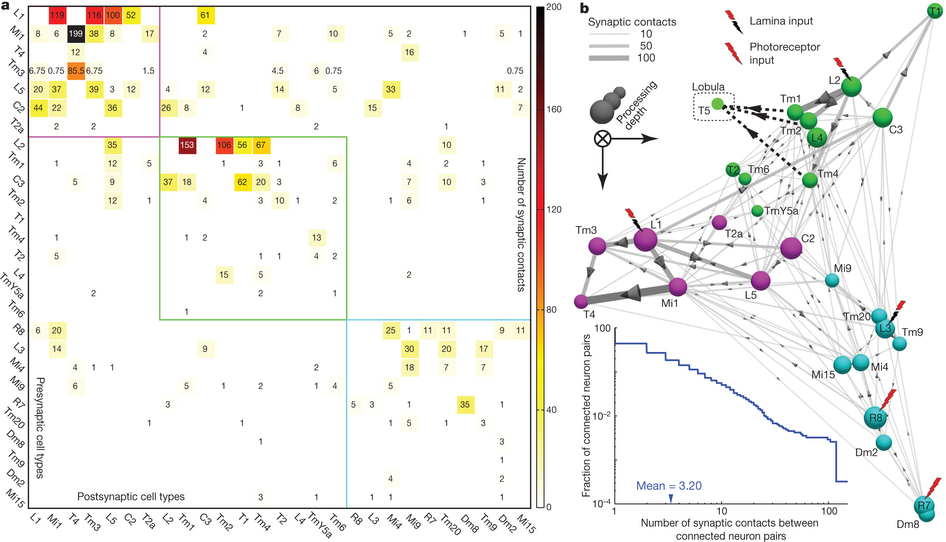
To look for the elementary motion detection circuit, they focused on neurons that appear at least once in each column and ignored those in the independent colour pathway. Because we know from behaviour experiments that motion detection is very resistant to noise, our suspects must receive strong connections from the lamina. Finally, as it is suspected that neurons T4 and T5 convey motion information from the medulla to further layers on the brain, the neurons involved in motion detection must make strong connections with them.
Takemura and his colleagues found that the neurons Mi1 and Tm3 fulfil those requirements in the L1/T4 pathway. They receive strong inputs from the lamina, via L1, and together they take more than 80% of the total input connections to T4. When Takemura and his colleagues looked at the combined arborisations of all the Mi1 connecting to a single T4 on one hand and all the Tm3 connecting to the same T4, they found that they overlapped much, but that there was a significative displacement between their centers of masses. This will allow each T4 to compare signals from different but closer points in the image. The researchers found that usually, but not always, this displacement was similar to the preferred direction of T4, as assessed by the area of the lobula plate they connected to. The biggest mismatch appeared in T4 cells whose preference direction is front to back, and the authors believe that it is due to them disregarding the inputs from another neurons (C3), that preferentially connect to that subgroup of T4 neurons.

Recording the activity of those small neurons is quite challenging, but in an article published in the same issue of Nature 3, Maisak et al. present some advances. Instead of measuring directly the electrical signal, sometimes it is easier to optically record the intracellular level of calcium, that correlates with the neuron activity. Maisak et al. applied this technique to study the activity of T4 and T5 neurons, confirming that they are composed by four populations each, tuned to image movement in the cardinal directions (front, back and to the sides). If a similar measurement in Mi1 and Tm3 (and Tm1, Tm2 and Tm4, the suspects for the T5 pathway) show that they are not motion sensitive, this will support the hypothesis that the nonlinear integration of the motion detector is implemented in the dendrites of T4 and T5, bringing us close to finish the quest for the elementary motion detector in the fly.
References
- Lav R. Varshney, Beth L. Chen, Eric Paniagua, David H. Hall, Dmitri B. Chklovskii “Structural Properties of the Caenorhabditis elegans” Neuronal Network PLoS Comput Biol. 7(2): e1001066 (2011) doi: 10.1371/journal.pcbi.1001066 ↩
- Shin-ya Takemura et al. “A visual motion detection circuit suggested by Drosophila connectomics” Nature 500, 175–181 (2013) doi:10.1038/nature12450 ↩
- Matthew S. Maisak et al. “A directional tuning map of Drosophila elementary motion detectors” Nature 500, 212–216 (2013) doi:10.1038/nature12320 ↩