Mid-life crisis in great apes

The term “midlife crisis” was coined in 1965 by psychologist Elliot Jacques. In our collective imaginary we believe that it refers to a time in life when adults realize that their life is halfway over, that they may not have achieved all the aspirations or dreams developed during youth, and they come to admit the reality of their own mortality.
Recent research conducted by economists and behavioural scientists explains midlife crisis claiming that human well-being —measured by happiness and mental health, among other variables— over a person’s lifespan adopts a characteristic U-shape. That is, well-being appears to be high in youth, then falls to its lowest point during midlife and rises again in old age. This pattern has been found in more than 50 countries, across different socio-economic backgrounds and cannot be explained by the effects of having young children in the house, sex differences or the greater longevity of happy people.
There is little agreement of theories on the origins of the U-shape: some state that the U-shape occurs because individuals at first realize with sadness that impossible aspirations cannot be attained and then these are slowly given up1, while others suggest that the curve is linked to financial problems and is likely to be less pronounced in older individuals who have achieved higher resources.
Since the human species evolved from ancestors of modern apes, a team of psychologists, primatologists and economists from the US, Japan, Germany and the UK have explored the alternative explanation that the U-shape found in humans’ well-being has also evolved in non-human primates, specifically in great apes. In this respect, last December they published a paper in PNAS which has created some controversy among scholars, showing that a similar U-shape exists in great apes2.
The sample included 336 chimpanzees and 172 orangutans coming from zoos, sanctuaries and research centres in the US, Australia, Japan, Canada and Singapore. Since we cannot ask primates about their well-being, researchers obtained the data by the method used for testing human subjective well-being, a four-item questionnaire modified for use in non-human primates3. Chimpanzees and orangutans were rated by humans with whom they had a close association —zoo keepers, researchers, caretakers and volunteers. They rated the apes on a seven-point scale in four questions:
-
the degree to which a subject was in a positive or negative mood
-
how much pleasure the subject derives from social interactions with others
-
the effectiveness of the subject in achieving its wishes or goals (i.e. desired locations or materials in the enclosure)
-
how happy the raters would be if they were that particular subject for a week.
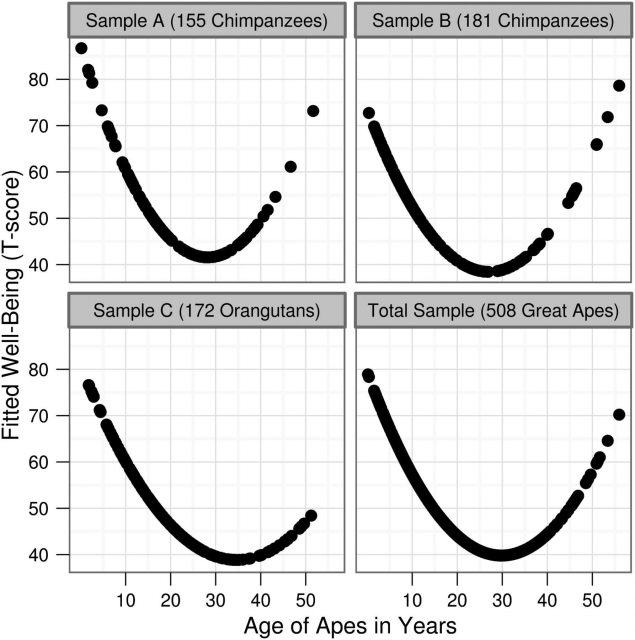
The interrater reliabilities for all four questions ranged from fair to excellent. Well-being scores were converted into T-scores for all analyses. Results showed that well-being in the apes fell in middle age —at 28.3 and 27.2 years old for the chimpanzees, and 35.4 years old for the orangutans— and climbed again as the animals moved into old age (see fig. 1). In captivity great apes may live to 50 or more. Thus, in all three groups the lowest well-being occurred at an age similar to midlife in humans.

Therefore, these findings seem to suggest that the midlife crisis may have its roots in the biology humans share with our closest evolutionary cousins. In my opinion, although I do not doubt that a similar U-shape pattern occurs in both humans and great apes, I am dubious about whether we can describe this fact as a midlife crisis, in the same sense as it is used in humans.
As a primatologist who has observed for long hours both captive chimpanzees and wild spider monkeys —a primate species with the same fission-fusion social organization as chimpanzees—, I would take these results with caution for two reasons. Firstly, in order to conclude that midlife crisis really exists in great apes, I think that the same questionnaire should be applied to a similar sample of chimpanzees and orangutans in the wild, in their natural habitat. There are field sites (e.g. Gombe National Park, Tanzania or Tai Forest, Ivory Coast) in which researchers know the chimpanzees individually as well as do zoo keepers, so the same method for assessing well-being could be applied. Moreover, we should bear in mind that we do not know exactly how lack of freedom affects personality features or “happiness” in captive chimpanzees and orangutans.
Secondly, since there are insufficient studies in primatology showing that great apes are good at seeing far into the future, it is difficult to imagine them musing on what life deserves them throughout their lifespan. Although I am not saying that they don’t do this, we do not have the means to search into it, to look through their eyes. Perhaps language studies that have taught great apes different sign languages to communicate with them have something to say about this.
References
- Frey, B.S., Stutzer, A. (2002) Happiness and Economics (Princeton Univ Press, Princeton, NJ). ↩
- Weiss, A., King, J.E., Inoue-Murayama, M., Matsuzawa, T., Oswald, A.J. (2012) Evidence for a midlife crisis in great apes consistent with the U-shape in human well-being. Proc. Natl. Acad. Sci. USA 109 (49): 19949-19952. doi:10.1073/pnas.1212592109 ↩
- Weiss, A., King, J.E., Murray, L. (2011) Springer Extras for Personality and Temperament in Nonhuman Primates (Springer, New York). ↩
5 comments
Nice article! I love the personal opinions in the last paragraphs.
I have a question regarding the U shapes figure: why are these U graphs fitted to a quadratic curve only represented by the fitted points, instead of giving the actual data points AND the quadratic curve?
Carlos and Sergio,
I am glad you liked the article. It was the authors’ choice to use the fitted points instead of the experimental data. In the case of human well-being the authors used multiple regression because there were many factors to be adjusted (such as income, education, location, etc.) But in the case of great apes they used a second degree polinomia (age and sex) and figure 1 represents the regression curve. You may want to see the p values in table 1 of the paper itself wive an idea of themodel congruence:
http://www.pnas.org/content/early/2012/11/14/1212592109.full.pdf+html
Maybe I should have explained more deeply in the article how analyses where done…
Although I agree that data coming from captive animals should be taken carefully, I find the results mind-blowing! . It is like in the case of some conclusions about treating cancer that come from ultra-inbred mice.
I would like to see real data, though; as Carlos already pointed out.
Really interesting!
I agree with Sergio and find it mind-blowing, regardless the future work needed to confirm and intepret the results…
[…] Artículo original publicado por Patricia Teixidor en Mapping Ignorance […]