Gone with the waves: the ups and downs of oceans and corals
Gone with the waves: the ups and downs of oceans and corals
News on global warming and sea-level rise flood our daily life. Even a modest decimeter increase of the current sea level will affect millions of people 1. Despite this gloomy scenario, we lack precise models to predict sea level changes during glacial and interglacial periods, such as the one in which we now live. As it is usual in Earth sciences, we then must learn from reading the past.
Researchers have developed ways of estimating past sea levels and applied them around the world during the last decades. These studies, however, offer sometimes contradictory reconstructions. To help untangling this puzzle Medina-Elizalde has now compiled and standardized thirty studies based on coral reefs spread along the Pacific, Atlantic, and Caribbean shorelines to build the first sea level curve based on these formations for the last 300,000 years 2.
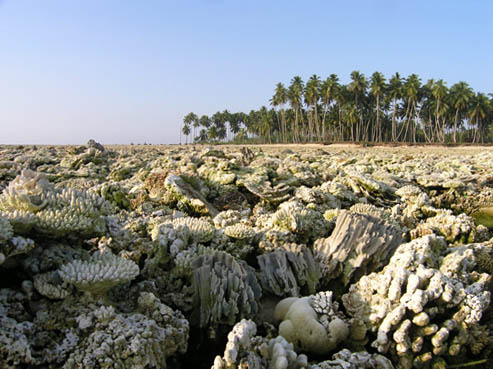
Why using coral reefs to gauge sea levels? These structures represent a fruitful collaboration between animals -corals-, and bacteria and plants -algae- living together and benefiting from each other. Their location is not random: corals die above sea level because they cannot breathe the oxygen in the atmosphere, but algae cannot survive under a few meters of water because they need lots of sunlight. Besides each coral species inhabits at a narrow (few meters) depth range, so even moderate sea level shifts may kill a particular species. If you add that coral reefs have been populating the oceans for more than 500 million years, all these features explain why corals constitute very accurate and convenient water depth markers.
But sea levels change often due to various causes. Sometimes these causes come from the deep interior of the planet that drives the plate tectonics waltz. For example, sea level lowers when continents join, such as during the last supercontinent Pangea 300 million years ago. A similar but more local effect happens when two continents collide, emerging shallow continental platforms that lay underwater before the crash. On the contrary, when spreading ridges at the oceans’ bottom extrude larger-than-average lava volumes sea level rises globally, while it drops if the erupted volumes diminish. Huge earthquakes can also generate local uplift or subsidence around its focus, depending on whether the rupture pushes up or down a coastal area. This happened in the Sumatra 2004 megaquake, which uplifted the island shoreline, killing corals exposed to our oxidative atmosphere.
Other times the cause lies on the Earth’s surface. During glaciations thick (as much as 4 km) ice caps sequester a large portion of Earth’s water, extending from the poles down to latitudes close to the Mediterranean area. Consequently global sea level plummets, reaching heights more than a hundred meters below the current one. But when a warmer interglacial period comes water flows back from the ice caps to the oceans, rising sea levels elsewhere. And more interestingly, wherever an ice cap existed the continents below suffered an enormous ice load that pushed them down. When ice caps melt continents react to the load removal by rebounding upwards, which locally counteracts somehow global sea level rise.
So if you want to understand the book of sea levels, you have to carefully weight all these factors. This is especially true if different writers transcribed each chapter: sampling sites may have experienced different uplift and subsidence stories and thus may provide different sea level reconstructions. That is why merging all these reconstructions requires detailed probabilistic assessments, as those did by Medina-Elizalde, which involved two methods. Bootstrapping consists in taking out one datum at a time, recomputing results, and checking how they change without that sample. In Montecarlo simulations you randomly choose as input only a fraction of your data and then recompute the results based on this partial dataset. Repeating this process thousands of times and averaging the simulated results you can compare them with those obtained from the whole dataset, which shows how statistically robust are the results. Both analyses allowed the author to remove outliers and discard possible site biases, which significantly improved the compilation.
There is one more thing: to use this underwater library you also need to accurately index each volume, which means precisely dating each sea level reading. Coral reefs are made of carbonate -the same chemical molecule that makes limestone-, which they synthesize and incorporate into their skeletons (in the case of corals) or tissues (algae). These molecules contain tiny fractions of uranium that comes from the one naturally existent in seawater. Uranium is well known by its natural radioactivity: it decays with time becoming another element, thorium. While the coral is alive it continues incorporating seawater -thus carbonate and uranium- into its body. When it dies, though, its parts fall to the seabed and the radioactivity clock starts ticking: since no more uranium enters the system and it keeps decaying, the relative proportion between uranium and thorium decreases continuously as time goes by. Measuring this proportion in a sample researchers can deduce the age when the coral died, and so when did it live (any organism life span dwarfs when compared with the geological times needed for uranium decomposition).
To make sure the chronologies from each study were accurate enough, Medina-Elizalde assessed their data quality and consistency, and then compared them with other stratigraphically continuous sea level proxies (such as the content of an oxygen isotope in benthic foraminifera). He found a reasonable agreement, but also some limitations on this approach, as for example the high variability observed before 119 kyears, which might depend on uncertainties in coral position or depth habitat estimates -the analyses discarded dating issues- and will require further work.
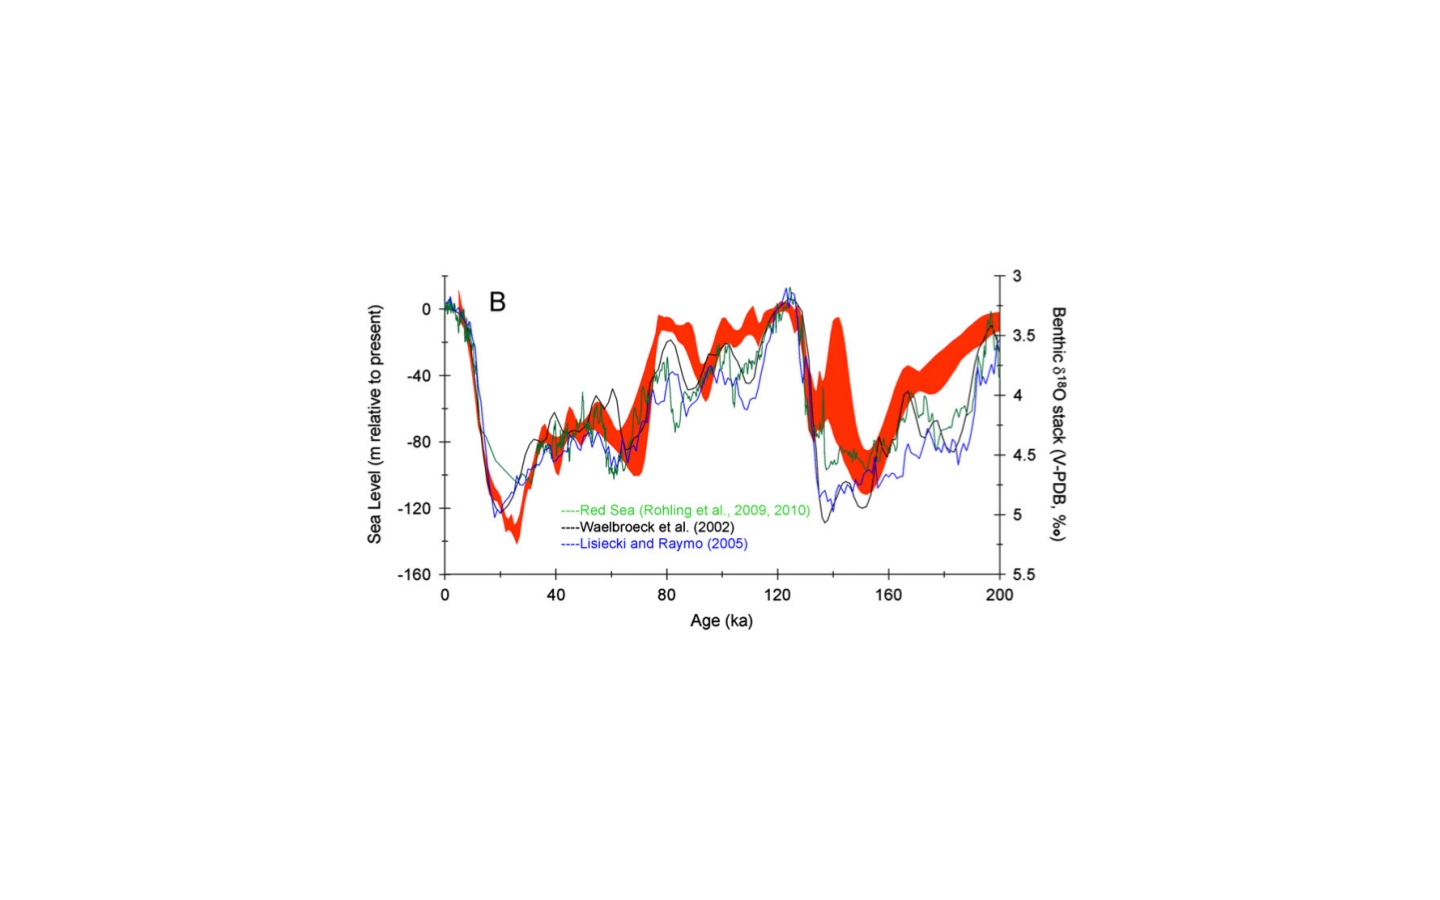
Overall the compilation presents a global sea level curve for the last 300,000 years that portrays a trend consistent with the results from other methods, where interglacials correspond well with highstand periods that peak between 5.5 and 9 meters above current sea level. The relevance of this study stands not only for its potential use in pinpointing glaciation onsets or as a starting point for in-depth analyses, but mainly because it provides another independent and homogeneous way of determining global sea levels, a needed resource to continue exploring the potential impact of the current climate change.
References
- International Panel on Climate Change (2007). Contribution of Working Groups I, II and III to the Fourth Assessment Report of the Intergovernmental Panel on Climate Change. Core Writing Team, Pachauri, R.K. and Reisinger, A. (eds.). IPCC, Geneva, Switzerland. Pp. 104. ↩
- Medina-Elizalde, M. (2013). A global compilation of coral sea-level benchmarks: Implications and new challenges. Earth and Planetary Science Letters 362, 310–318. doi: 10.1016/j.epsl.2012.12.001 ↩