Insights into a star forming Universe
Insights into a star forming Universe
Go to a dark place and look to the night sky. How many stars you can count? This is an ancient question which can be traced back at least to the classic Greek philosophers. However, no matter how dark your sky is, the stars you are seeing are all related to our home, the Milky Way Galaxy. When Galileo Galilei turned his small telescope into it he discovered that the band crossing the sky was also composed of hundreds of stars, too dim to be visible to the naked eye. We know now that ours is just one of the millions and millions of galaxies in the Universe. And we also know that stars, galaxies and even the Universe are continuously evolving. Let’s focus today on the Star Formation Rate, the number which determines whether the total amount of suns increases or decreases with time at a given location. This issue has been adressed in a recent review by Mac Low in the Science magazine 1.
We can make a good estimate of the present SFR in our current, neighbouring Universe. And we can also agree that 300,000 years after the Big Bang, when the cosmic microwave background was emitted, there were no stars at all. What happened in the meantime? We are all familiar with the concept of finite light speed and so we all understand that looking far in the Universe also means looking into the past. This is the way to estimate the SFR at different times after the Big Bang. However, as one looks further and further it becomes increasingly difficult to detect the smallest, less bright galaxies. So this method works well diving some 12 billion years into the past (or redshift z = 4) but not more. Even at this point it becomes clear (see Figure 1) that SFR was maximum 10 billion years ago (or z = 2).
What happened before that? The problem is that at z = 4 the evidences from the two sources of information we currently have diverge. One the one hand, the galaxies detected by observing the redshifted Lyman-alpha line predict a very low SFR. On the other hand, the detection of highly collimated beams of gamma-rays in some supernovas (usually called Gamma Ray Bursts or GRBs) points to a SFR lower than the maximum at z = 2 but orders of magnitudes above what the other technique supports. It has been proposed that galaxies producing GRBs could be anomalous in terms of metallicity and star formation but this hypothesis is in conflict with other observations.
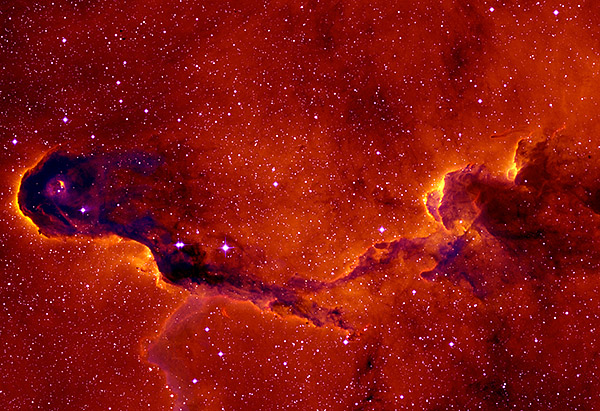
When observational data disagree is time to construct a physical model of the problem, so the scientists can spot the odd data out and hopefully understand all the observations at the same time in a comprehensive framework. Among the state of the art models for star formation Mac Low highlights a particular aspect of the problem: energetic feedback and turbulence. The basic question here is to understand whether or not the energy released by stars is increasing or decreasing the star formation in their surroundings. This is a tricky point since it can be shown that the energy injection can do both things. However, observations and models do show that the turbulence generated in the highly supersonic jets in supernova explosions basically prevents further star formation, even though it can promote it locally. This has been observed in regions as the one shown in Figure 2, the Elephant Trunk Nebula. The supernova jets are not the only source of turbulence in the interstellar medium since magnetorotational instability or radiation pressure can also contribute to the turbulence and thus help inhibiting star formation. This is the kind of problem that the numerical computations still need to address correctly in order to produce a reasonable model of the evolving Universe.
While modeling astrophysicists are improving their numerical models for star formation, observational astronomers are still looking for an empirical law to compute the SFR with handy observables. One of the most notable correlations is that of the SFR with the total gas surface density of a galaxy, which is mostly linear (or truly, exponential) for some regimes (see Figure 3). Mac Low wisely points out that correlation does not imply causality and argues that previous work supports that the correlation may be caused by the role of the scarce grains of dust in the interstellar medium. Those grains would shield the gas from the energetic radiation and therefore contribute to increase SFR. At the same time, dust grains are the place where the hydrogen atoms can meet and form molecules, since the grains act as a catalyst for such an improbable meeting.
Right now we are still waiting for the major advance that will help us to understand the star formation rate in the distant Universe. Observations will be surely come with new observatories such as the James Webb Space Telescope or the European Extremely Large Telescope. And further advances in modeling the evolution of the Universe are also expected. In the end, we have seen that SFR is closely tied to the amount of heavy elements in galaxies. The very same heavy elements that builds rocky planets and living organisms. So in the end, this is also a quest to understanding the evolution of the Universe habitability. This is maybe not the most important aspect of the evolving Universe we live in, except possibly for us, the ones who went out some obscure night to count the stars.
References
- Mac Low M.M. (2013). From Gas to Stars Over Cosmic Time, Science, 340 (6140) 1229229-1229229. DOI: 10.1126/science.1229229 ↩