The role of clouds in Greenland’s melting July 2012
The role of clouds in Greenland’s melting July 2012
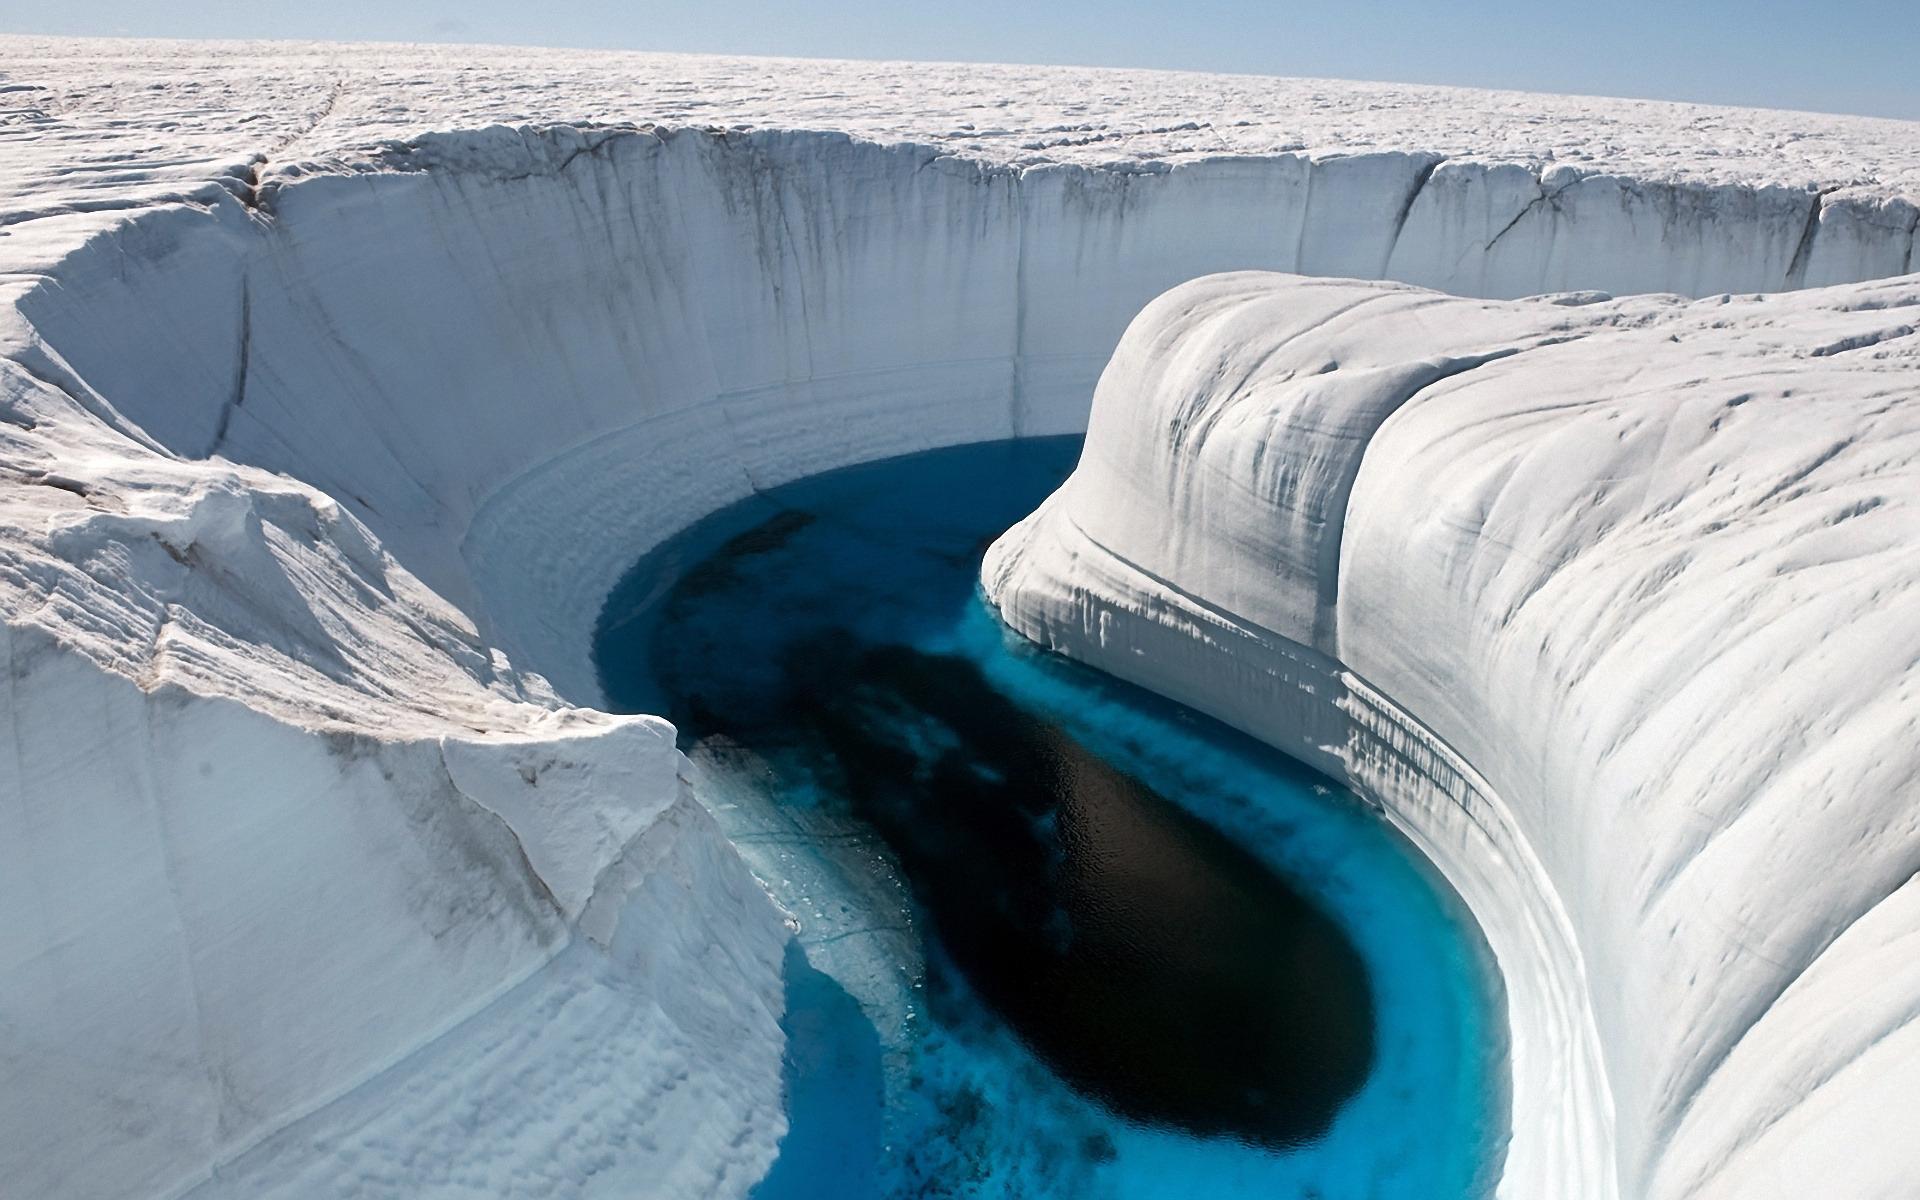
Locations with an extreme climate are more sensitive to changes in the global conditions. We could say that such places live in the razor’s edge, where a subtle change makes the difference between life and death. A good laboratory for testing those ideas is Greenland. Once settled by Norsemen and Icelanders, at the end of the first millennium, it became desert again by 1400 – 1500 A.D.. Why? Both facts are well correlated with two well-known climatic anomalies, as it has been pointed out many times. The first one is the Medieval Climatic Anomaly, when the temperature raised a few degrees at the northern Atlantic regions for a few centuries. The second one is usually called the Little Ice Age and showed an opposite sign. Following this simplified description, Greenland was at some point mild enough to be populated but eventually low temperatures were too hard even for the tough Norsemen. An in-depth discussion of the complexity of this process can be found in the famous book by Jared Diamond “Collapse: How socities choose to fail or survive”. In any case, the ice cores retrieved at Greenland demonstrate that temperatures have been dramatically variable at this part of the world during the last 100,000 years.
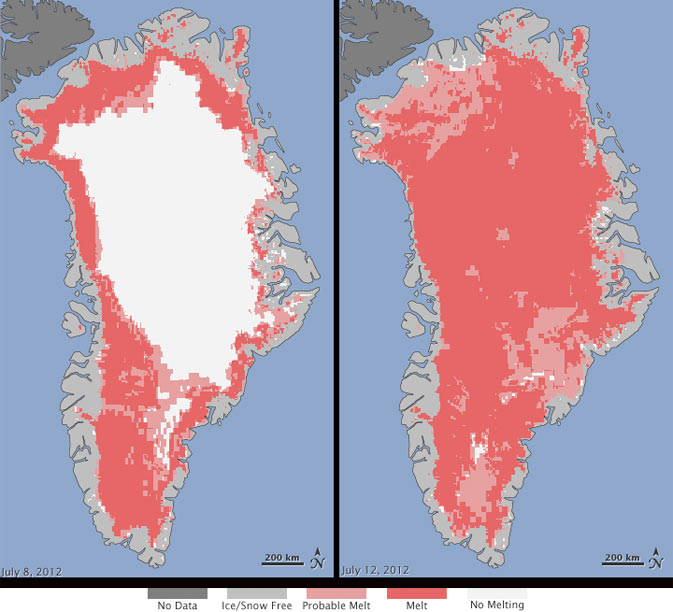
A very good example of this variability showed up last summer. On July 12, about 97% of Greenland’s Ice Sheet (GIS) melted up to some degree 1. This was a fast process which lasted a few days, as shown in the picture below. This notice was taken with joy by a fraction of the press, which claimed something like the melting of all the ice on Greenland. This was not fortunately the case, since this would represent an immediate sea level rise of about seven meters. However, even if not so Holliwood-esque, the event was quite important in climatological terms. The previous similar event happened in 1889. Before that, we have to use our time machines to travel eight centuries into the Medieval Climatic Anomaly. That sounds disturbing for those of us who live close to the shore line, doesn’t it?
In any case, we have something Vikings never had: satellites. The melting event was observed with unprecedented detail by a number of instruments onboard meteorological satellites. In particular, the extreme melt was discovered by the scatterometer on the Indian Oceansat2 satellite. A scattoremeter is a kind of radar, in this case working at the Ku-band at 13.4 GHz, sensitive to snow wetness. Following the discovery, the event was also registered by the Moderate-resolution Imaging Spectroradiometer (MODIS) on NASA’s Terra and Aqua satellites. This instrument is able to image Earth’s surface in 36 narrow bands from the blue wavelengths to the infrared (0.4 – 14.0 microns). Infrared observations require an algorithm to eliminate cloud masking but they are able to determine surface temperatures. Finally, the Special Sensor Microwave Imager/Sounder (SSMIS) on a Defense Metorological Program satellite also recorded the event at microwave wavelengths. Even though the amount of information was already impressive, this was later extended by in-situ recordings and observations from local weather and ice drilling stations.
At that point of the story, the melt was referred as caused by ‘an anomalous ridge of warm air [that] become stagnant over Greenland’, Nghiem and collaborators said. The exact terms of such process were unknown until a paper recently published in Nature magazine by Bennartz et al. 2 where they proposed a mechanism able to reproduce observations. Following these authors, low clouds have the smoking gun.
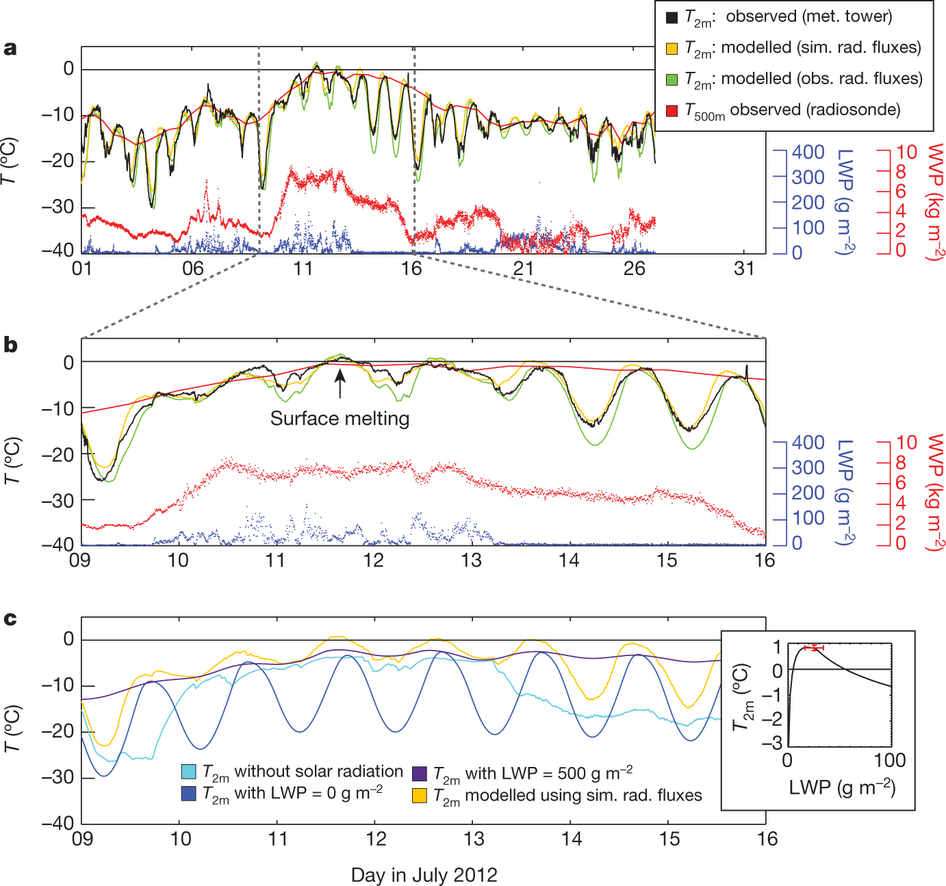
In short, we need to understand how conditions leading to surface melt can be reached. This is particularly true since the above mentioned warm air was not warm enough to justify the event. What these authors propose is to model upward and downward fluxes close to the surface in the short- and long-wave bands. The shortwave components take into account the radiative effects induced by water vapour, ozone, carbon dioxide, water content and surface albedo. The longwave components include thermal emissions from the surface, clouds and atmospheric gases.
Using such a relatively simple scheme, Bennartz and collaborators were able to reproduce the observed temperature fluctuations in the dates of interest to a reasonable extent. It was clear that on July 12, surface melting was caused by a temporal increase of surface temperature, but why?
After that, a careful sensitivity study was able to demonstrate that the amount of liquid water was the responsible for crossing the no return point. Low level clouds have a double effect on the net fluxes on surface. On the one hand, they block solar radiation, therefore reducing the amount of flux reaching the surface. On the other hand, they also block longwave infrared radiation reinforcing the so-called greenhouse effect. Should those cloud be a little thicker, their net effect would have been the opposite, reducing local temperatures. Conversely, higher clouds would have result in less infrared radiation being trapped and, again, lower temperatures at surface and therefore, no melting. Bennartz et al. show that the amount of water was finely tunned in order to make the temperatures at surface cross the melting line. They also show that low-level liquid clouds are very frequent over Greenland and the Arctic, being present there about half of the time.
A word of caution must be raised regarding low-level liquid clouds. Our current climate models are not very good at predicting their frequency. It is obvious that we need a better description of these clouds if we want to understand and properly predict the phenomena raising in a warming Arctic. Given the potential rise on sea level that melting processes can generate it would be certainly a good idea to take care of this detail. Otherwise, we may end taking our ships and moving to more comfortable lands, just as Vikings did.
References
- S.V. Nghiem, D.K. Hall, T.L. Mote, M. Tedesco, M.R. Albert, K. Keegan, C.A. Shuman, N.E. DiGirolamo and G. Neumann (2012). The extreme melt across the Greenland ice sheet in 2012. Geophysical Research Letters, 39, L20502. d.o.i.: 10.1029/2012GL053611 ↩
- R. Bennartz, M.D. Shupe, D.D. Turner, V.P. Walden, K. Steffen, C.J. Cox, M.S. Kulie, N.B. Miller and C. Pettersen (2013). July 2012 Greenland melt extent enhanced by low-level liquid clouds. Nature, 496, 83-85. d.o.i.:10.1038/nature12002 ↩