To know the dark
To know the dark
Some weeks ago I came across a little poem via Twitter (ah, the modern world!). It was authored by Wendell Berry, an american writer and farmer very involved in ecologic farming activism. Let’s meet the poem:
To go in the dark with a light is to know the light.
To know the dark, go dark. Go without sight,
and find that the dark, too, blooms and sings,
and is traveled by dark feet and dark wings.
When observed under the light (pun intended) of what comes below, these verses acquire a different aspect, even though I understand that the author might not be thinking of it when composing the lines.

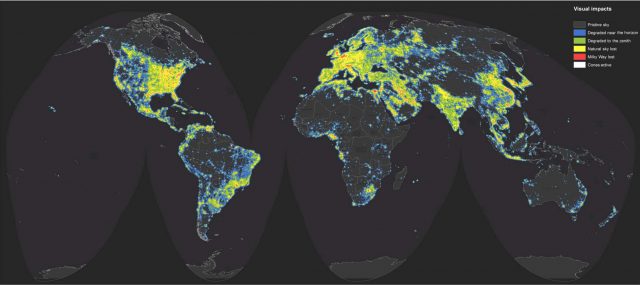
Shortly before last summer, a new world atlas of light pollution was published 1. Light pollution is defined by the International Dark Sky Association as the “inappropriate or excessive use of artificial light” 2. This means that, while illuminating our cities, roads or oil extraction fields, some (or even most) of the energy is lost to the space with no other effect than transforming the sky night into a glowing mess. Results by Falchi and collaborators were devastating. More than one third of the human kind is unable to see the Milky Way any time of the year, making 60% of the Europeans and 80% of North Americans. The most light polluted skies are found in Singapore, as the human eye is unable to adapt to night-vision.
Is this really a problem or this just another consequence of progress? It certainly is a problem for astronomers, who have been struggling with light pollution at least for 60 years, moving observatories to darker and more remote locations, leaving behind the historical sites where the first steps of the modern astronomy were accomplished. But this is not just a trouble for a bunch of mad scientists. The bibliography is growing fast with the effects of light pollution on ecology (particularly on migrating birds and insects), economy (waste of resources), sociology (false perception of security), human physiology (alteration of circadian cycles) and many other fields. There is still no solid evidence for all correlations but the picture is getting clearer every year. You can find an excellent introduction to these aspects in the Ph.D. of Alejandro Sánchez de Miguel3.
Quantification is the first step in science. A good summary of the available light pollution indicators is exposed in 4. The most obvious one is based on the visual perception. Even though it may look like a subjective evaluation, most amateur astronomers know that an experienced observer can provide an excellent evaluation of the sky quality. However, the introduction of CCDs and photometers which respond linearly to incoming radiation together with the development of radiative transfer methods for the computation of light pollution propagation made possible to construct a new framework for the analysis of the problem. Measurements can be integrated in time, wavelength and direction or provide resolution at one or more of these dimensions. On the other hand, data can be retrieved by directly measuring directly the brightness of the sky from the ground [Ref. 2] or the upgoing radiation seen from satellites [Ref. 1].
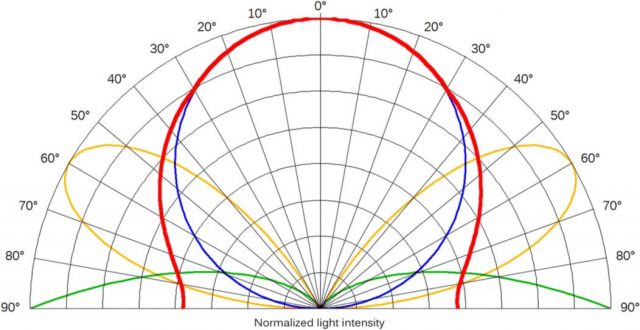
Measurements from space came primarily from US Air Forc Defense Meteorological Satellite Program (DMSP) Operational Linescan System (OLS) which was designed to map human settlements. Results from [Ref. 1] were also obtained from the Visible Infrared Imaging Radiometer Suite (VIIRS) Day/Night Band (DNB) onboard the Finnish satellite Suomi National Polar-orbiting Partnership weather satellite. Another recent source of information are the images taken by astronauts flying in the International Space Station [Ref. 3]. One big problem with upward measurements is to determine how the light from the ground is emitted. Poorly shielded luminaries in cities contribute to low-angle upward emissions in cities, which add to zenith directed Lambertian reflection of lights over the ground. Although this distribution is commonly assumed as universal [Ref. 1], local changes can be significant and affect the estimation of sky brightness, requiring local measurements from the ground which involve a substantial effort to be obtained.

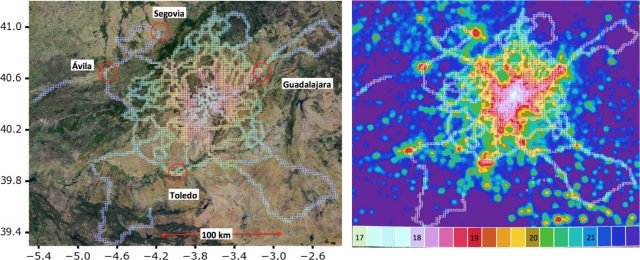
A good example on how to create a grid of ground-based observations of sky brightness around the crowded city of Madrid, Spain, can be found in [Ref. 2]. The use of Sky Quality Meters (SQM) photometers mounted on private cars are able to map the brightness around a big city. Complemented with all-sky cameras on selected sites, they provide the required cross calibration for satellite imaging. As highlighted by [Ref. 1], such studies also provide an invaluable source of information for future studies all over the world and an excellent identification of the particular sources of light pollution that contribute the most to sky brightness at a local scale.
If astronomers are supposed to know the dark, we must go dark. This means not only searching for the most distant spots in the globe, which are still under threat, but also to rationalize the energy consumption. At last instance, astronomers could move our observatories to space, where no light pollution is reported yet. But the humankind would lose the natural and cultural experience of seeing the starry night sky. We might become like the people in Asimov’s Nightfall, illuminated by many suns and ignorant of the Universe above. So, if you do not want to lose this magnificent treasure, turn off your outdoor lightning and go out. Because, you know, to go in the dark with a light is just to know the light.

References
- The new world atlas of artificial night sky brightness . Fabio Falchi, Pierantonio Cinzano, Dan Duriscoe, Christopher C. M. Kyba, Christopher D. Elvidge, Kimberly Baugh, Boris A. Portnov, Nataliya A. Rybnikova and Riccardo Furgoni (June 10, 2016) . Sci Adv 2016, 2:. doi: 10.1126/sciadv.1600377 ↩
- Testing sky brightness models against radial dependency: a dense two dimensional survey around the city of Madrid, Spain. J. Zamorano, A. Sánchez de Miguel, F. Ocaña, B. Pila-Díez, J. Gómez Castaño, S. Pascual, C. Tapia, J. Gallego, A. Fernández, M. Nievas (2016). Journal of Quantitative Spectroscopy and Radiative Transfer 181, 52 – 66. doi: 10.1016/j.jqsrt.2016.02.029 ↩
- Variación espacial, temporal y espectral de la contaminación lumínica y sus fuentes: Metodología y resultados. A. Sánchez de Miguel (2016). Ph.D. Thesis, Universidad Complutense de Madrid, Spain. http://eprints.ucm.es/31436/ ↩
- Quantifying light pollution. P. Cinzano, F. Falchi (2016). Journal of Quantitative Spectroscopy and Radiative Transfer 139, 13 – 20. doi: 10.1016/j.jqsrt.2013.11.020 ↩
3 comments
Hi, for my thesis is available now a translation into English: https://www.researchgate.net/publication/304212932_Spatial_Temporal_and_Spectral_Variation_of_Light_pollution_and_its_sources_Methodology_and_Resources
[…] La contaminación luminosa es un problema gravísimo para los astrónomos, y priva al ciudaddano de a pie de uno de los espectáculos más sobrecogedores que existe: la observación a simple vista del cielo nocturno. El nivel de esa contaminación […]
[…] Esta entrada es una traducción de mi post original en Mapping Ignorance que puedes consultar aquí. […]