Sensograph: Fast sensory evaluation using computational geometry
Sensograph: Fast sensory evaluation using computational geometry
Sensory profiling is a very important tool in food industry, crucial in order to adapt the products to consumers’ preferences. Quantitative Descriptive Analysis (QDA) is a precise tool to relate characteristics of the product with consumers’ perception, since trained panels provide very detailed, robust, consistent, and reproducible results 1. However, creating and maintaining a well-trained and calibrated panel takes a long time and becomes costly.
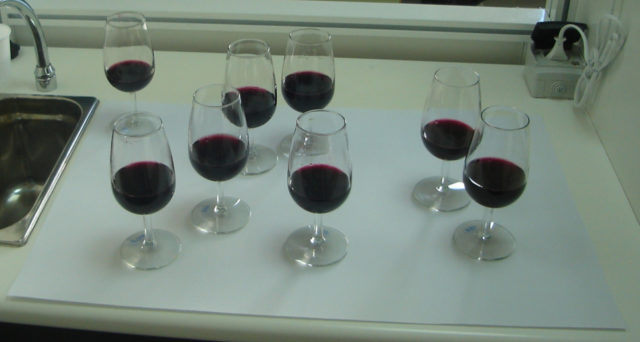
With the aim of palliating these issues, several alternative methods have arisen 2, in which not necessarily trained assessors provide a fast sensory positioning of the products evaluated. Skipping the need to train the panellists allows to obtain results without the need of waiting a long time. In particular, Projective Mapping 3 collects data by asking the assessors to position the samples on a two-dimensional space, usually a blank sheet of paper acting as a tablecloth. The assessors just have to position the samples on the tablecloth in such a way that, the more similar they perceive two samples, the closer they should position them, and vice versa. See Figure 1 for an example.
The data obtained can then be analyzed by statistical tools like Principal Component Analysis (PCA) 4, Generalized Procrustes Analysis (GPA)5, or Multiple Factor Analysis (MFA) 6, the latter giving rise to the method named Napping 7. In essence, these statistical methods use linear algebra in higher dimensions and, from the tablecloths containing the opinions of the assessors, generate an average tablecloth which reflects the opinion of the whole panel. See Figure 2.
However, the use of statistical tools is not free of risks 8, like ‘click and go’ users aiming to obtain results without knowing how the tools work 9. This is why, in the recent paper 10, we have proposed SensoGraph, a method using only geometric techniques in 2D that can be easily understood. For an example, imagine a tasting session where four assessors have expressed their opinions as the four tablecloths in Figure 3.
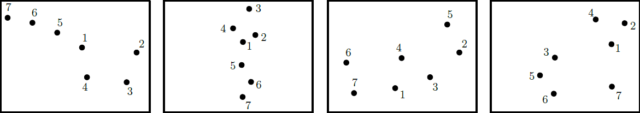
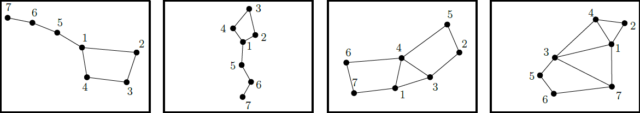
The astute reader can realize that the first two tablecloth provide a similar information. In both cases, the assessors have grouped the samples 1,2,3,4 and then placed samples 5,6,7 getting further from sample 1. In order to computationally extract this information that we, humans, can intuit by eye, the first step of SensoGraph performs a clustering in the way an astronomer groups stars into constellations, according to their relative positions in the sky. Two points P,Q will be joined by a segment PQ whenever the circle having that segment PQ as diameter does not contain any third point. Figure 4 shows an example and the segments obtained for the first tablecloth in Figure 3 (which happens to resemble the Big Dipper of the constellation Ursa Major). Points 6,7 are joined, since the corresponding circle is empty of other points, while points 4,5 are not joined because their circle does contain point 1.
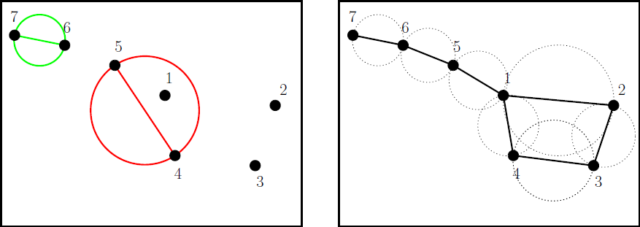
In Mathematics, the constellations obtained as before are called Gabriel graphs 11. Thus, after the first step of SensoGraph we obtain one of these graphs for each of the tablecloths, as in Figure 5. In particular, we observe that the first to tablecloths give rise to the same graph, which reflects the previously observed fact that they provide the same information.
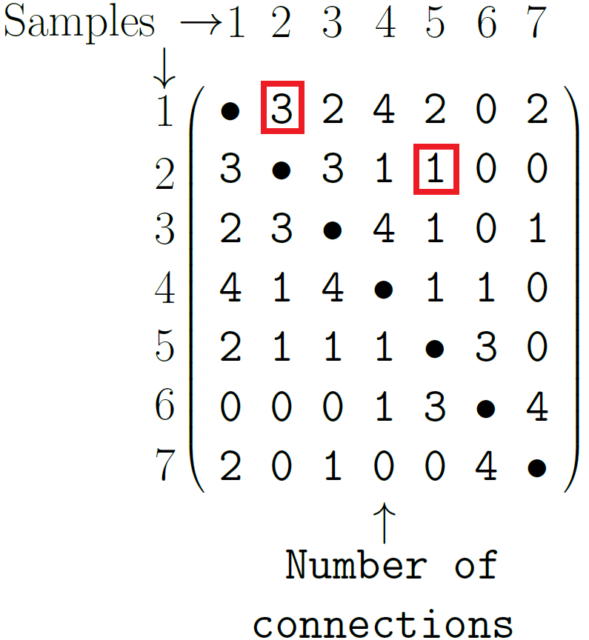
The second step in SensoGraph is counting, for each segment, in how many tablecloths it appears. For the example in Figure 5, the segment 1-2 appears in three of the tablecloths, reflecting that most of the assessors have perceived as similar the samples 1 and 2. On the contrary, the segment 2-5 appears only in one tablecloth, indicating that only one assessor found similar those samples. This counting can be conveniently stored as a matrix, where the entry P,Q stores the number of appearances of the segment P-Q. Figure 6 shows the matrix for the previous example, highlighting the cases just discussed.
For the third and last step, SensoGraph draws the final consensus graphic from the previous matrix.
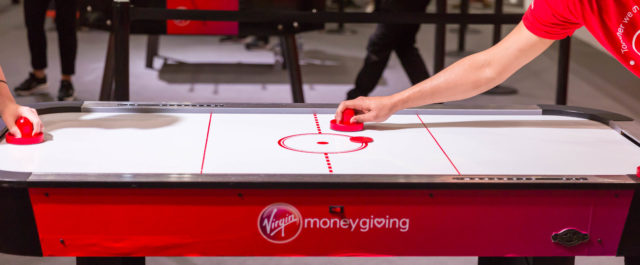
Imagine that for each sample (1) we arbitrarily place a disk on an air hockey table (Figure 7), pinning the disk to the table, (2) we join each pair of disks P,Q with an elastic rubber band which attracts those disk with the strength indicated in the corresponding entry P,Q of the previous matrix, and (3) we release all the pins at the same time.
The disks will then slide over the table, approaching each other according to the strength of the rubber bands, until an equilibrium situation is reached. This intuitive idea is modeled by the Kamada-Kawai algorithm for graph drawing 12, which is used by SensoGraph to obtain the consensus positioning. Figure 8 shows the graphic for the previous example, where opacity and thickness of the segments reflect the corresponding strength of the rubber bands.
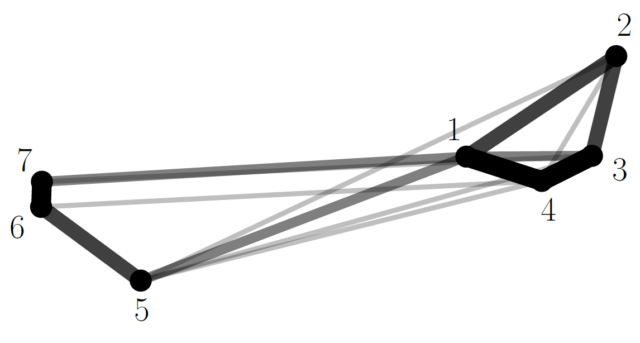
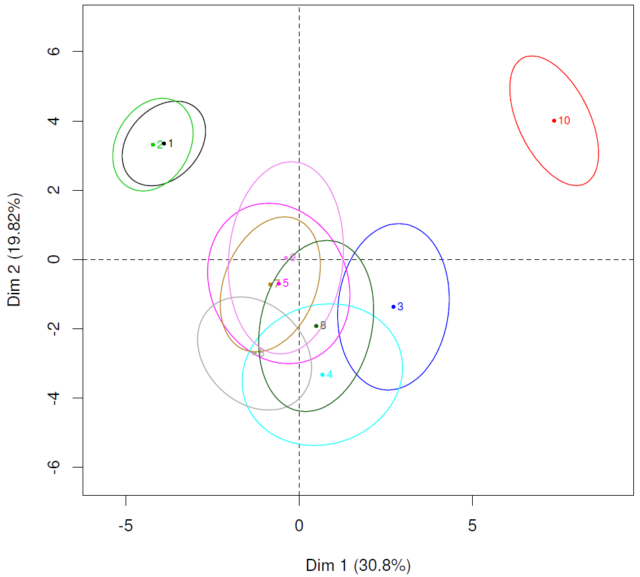
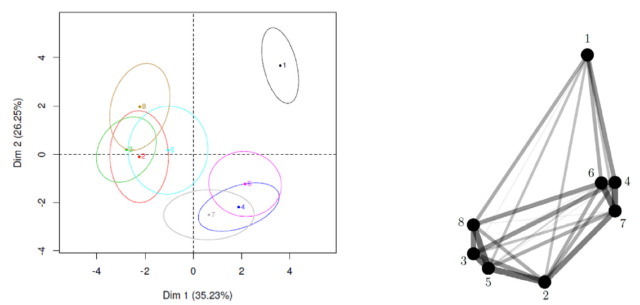
In this example, we can clearly observe two groups 1,2,3,4 and 5,6,7, which was clear for the two first tablecloths in Figure 3, but not so clear for the others. For another example, Figure 9 allows to compare the results provided by Napping and SensoGraph for a panel of twelve assessors with previous experience tasting red wines from cv. Tempranillo and Toro appellations, after a single training session in the method. Both graphics show clear groups 2,3,5,8 and 4,6,7, with the wine labeled as 1 clearly different from those two groups.
The main contribution of our paper [10] is, then, showing that Sensory Analysis can be performed with basic, geometric, two-dimensional notions, without the need of highly specialized personnel. The results obtained are similar to those provided by more complex and costly statistical tools, so that SensoGraph arises as an intermediate choice between not performing any Sensory Analysis at all or devoting enough time and resources to use classic techniques in Sensory Analysis like QDA.
Note: This text is part of the dissemination activities of the Marie Skłodowska-Curie grant No 734922 in the European Union’s Horizon 2020 research and innovation programme.
References
- Moussaoui, K. A., & Varela, P. (2010). Exploring consumer product profiling techniques and their linkage to a quantitative descriptive analysis. Food Quality and Preference, 21(8), 1088–1099. ↩
- Varela, P., & Ares, G. (2012). Sensory profiling, the blurred line between sensory and consumer science. A review of novel methods for product characterization. Food Research International, 48(2), 893–908. ↩
- Risvik, E., McEwan, J. A., Colwill, J. S., Rogers, R., & Lyon, D. H. (1994). Projective mapping: A tool for sensory analysis and consumer research. Food Quality and Preference, 5(4), 263–269. ↩
- Gabriel, K. R. (1971). The biplot graphic display of matrices with application to principal component analysis. Biometrika, 58(3), 453-467. ↩
- Gower, J. C. (1975). Generalized procrustes analysis. Psychometrika, 40(1), 33-51. ↩
- Escofier, B., & Pages, J. (1994). Multiple factor analysis (AFMULT package). Computational statistics & data analysis, 18(1), 121-140. ↩
- Pagès, J. (2005). Collection and analysis of perceived product inter-distances using multiple factor analysis: Application to the study of 10 white wines from the Loire Valley. Food quality and preference, 16(7), 642-649. ↩
- Granato, D., de Araújo Calado, V. M., & Jarvis, B. (2014). Observations on the use of statistical methods in food science and technology. Food Research International, 55, 137-149. ↩
- Nunes, C. A., Alvarenga, V. O., de Souza Sant’Ana, A., Santos, J. S., & Granato, D. (2015). The use of statistical software in food science and technology: Advantages, limitations and misuses. Food Research International, 75, 270-280. ↩
- Orden, D., Fernández-Fernández, E., Rodríguez-Nogales, J.M., and Vila-Crespo, J. Testing SensoGraph, a geometric approach for fast sensory evaluation. Food Quality and Preference 72 (2019), 1-9. doi: 10.1016/j.foodqual.2018.09.005 ↩
- Gabriel, K. R., & Sokal, R. R. (1969). A new statistical approach to geographic variation analysis. Systematic zoology, 18(3), 259-278. ↩
- Kamada, T., & Kawai, S. (1989). An algorithm for drawing general undirected graphs. Information processing letters, 31(1), 7-15. ↩