Shear-driven drug delivery service

Disruption of normal blood flow to vital organs such as the heart, lung, and brain is the main cause of death in adults in the Western world. Current therapies require hospital facilities, since clot-lysing drugs are administered systemically or through a catheter placed within the obstructed vessel. Besides, the doses are limited by the potential risk of bleeding. To overcome these limitations, Korin et al. 1 propose a drug delivery system based on flow characteristics in narrowed vessels that concentrates the drug in these regions. This simple strategy lowers required drug doses and minimizes side effects while maximizing the efficacy of the treatment.

In normal blood vessels, the shear stress has values below ~70 dyne/cm2 (7 Pa). In case of stenosis or thrombosis, shear stress can increase by one or two orders of magnitude to >1000 dyne/cm2 (100 Pa). When this happens, platelets are naturally activated in these regions, adhering to the surface of the already narrow vessel making it even narrower. Inspired by this natural targeting phenomenon, Korin et al. propose a therapeutic strategy that uses local high shear stress as a generic mechanism to target drug delivery. The shear-activated nanotherapeutics (SA-NTs) are basically aggregates of smaller nanoparticles, and have a total diameter of 1 to 5 m (similar to actual platelets). When blood flows under normal conditions, the aggregates remain intact; but when they are exposed to high local shear stress, they breakup into nanoscale components. Due to the smaller size of the nanoparticles, the drag they experience is smaller, and they can adhere more easily to the walls of the vessel. Adhesion can be further enhanced by coating the particles with molecules that bind to endothelial cells (cells of the inner surface of blood vessels) or other relevant targets.

Experimental tests

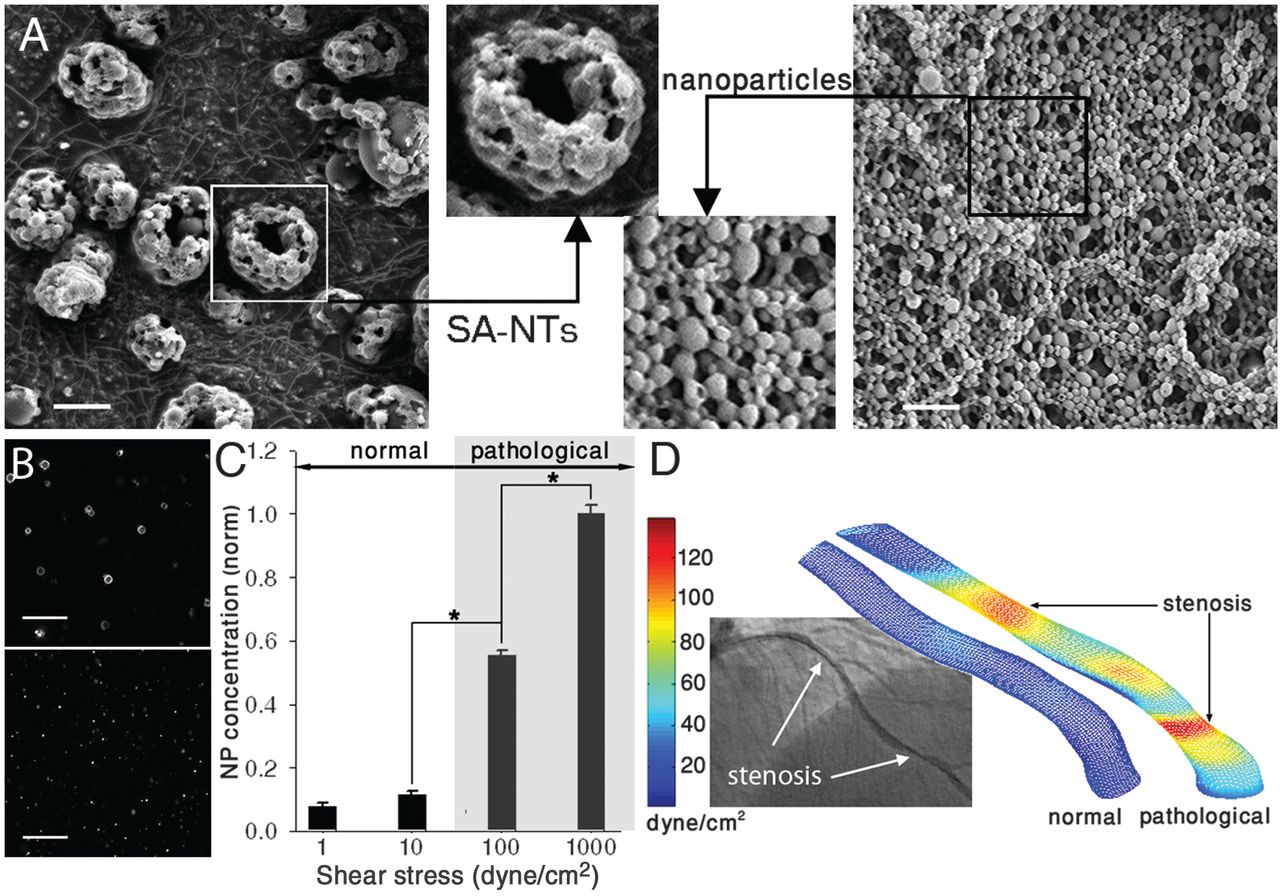
The SA-NTs used in the experiments were produced by spray-drying a solution of poly(lactic-co-glycolic acid) (PLGA 50:50, MW 17 kD), obtaining aggregates of () that are composed of small () nanoparticles (Fig. 1A).

Initially, in order to determine the shear-sensitivity of breakup mechanism, Korin et al. applied different controlled shear stresses to SANTs, detecting an 8- to 12-fold increase in the concentration of released NPs when the level of shear reached 100 dyne/cm2 (10Pa) or higher (Fig. 1C).

Figure1. (A) Scanning electron micrographs of the microscale (~2 to 5 μm) SA-NTs (left) and the PLGA nanoparticles (~180 nm) used to produce them (right). Scale bar, 2 μm. (B) Fluorescence micrographs demonstrating intact SA-NTs (top) and NPs dispersed after their exposure to 1000 dyne/cm2 for 10 min by using a rheometer (bottom). Scale bar, 10 μm. (C) Quantification of release of fluorescent NPs from the SA-NTs as a function of shear. (D) CFD simulations comparing fluidic shear stress in a normal coronary artery (left) and a stenotic vessel with a 60% lumen obstruction (right). Left inset shows the corresponding angiogram of the stenotic left coronary artery in a 63-year-old male patient. | Credit: Korin et al (2012)

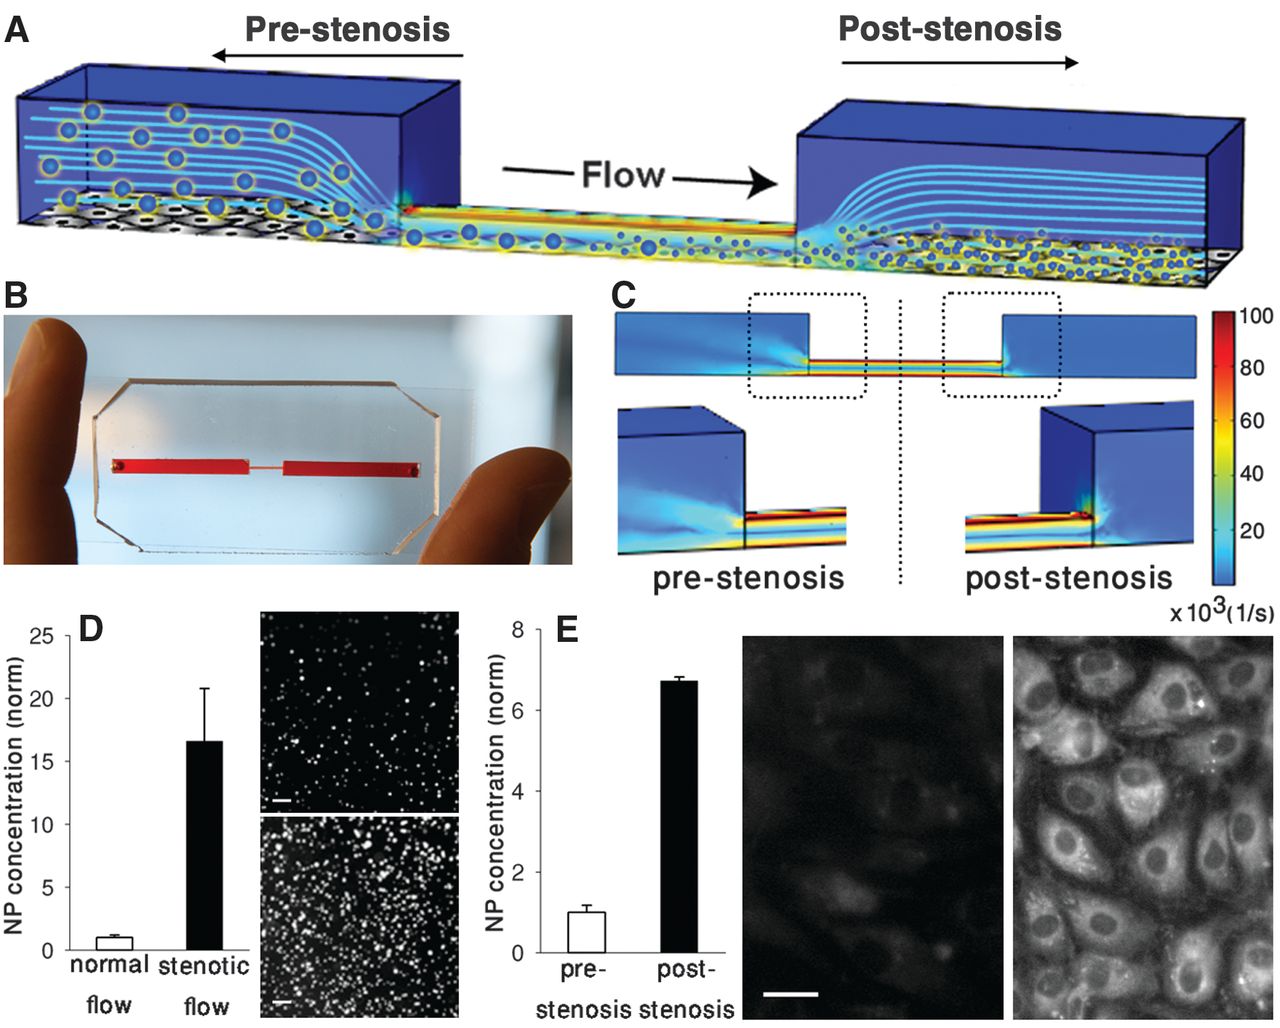
Next, they measured the release of nanoparticles in constrictions under actual blood flow conditions to determine how effective this selective targeting is. Tests were carried out in a three-dimensional microfluidic model of a constricted blood vessel with 90% lumen obstruction made of a silicon-based organic polymer (poly-dimethylsiloxane) (Fig. 2, A and B). CFD simulations of this model revealed that the shear rate at the constriction is increased ~100-fold (Fig. 2C). The experiments showed a 16-fold increase in the release of nanoparticles respect to that of unobstructed channels of similar dimensions (Fig. 2D). Besides, fluorescence imaging confirmed that the nanoparticles accumulated in the narrowed region, while very few were released upstream of the constriction (Fig. 2E).

Figure 2. (A) Microfluidic vascular stenosis model showing how SA-NTs (large spheres) should remain intact in the prestenotic region but then break up into NPs (small spheres) when they flow through a constriction (90% lumen occlusion) and can accumulate in endothelial cells lining the bottom of the channel. (B) Microdevice that mimics vascular stenosis fabricated in PDMS. (C) CFD simulations of the microfluidic device shown in (B) demonstrating 100-fold increase in shear rate in the region displaying 90% lumen occlusion. (D) Release of fluorescent NPs from SA-NTs through the channel shown in (B) compared with flow through an unconstricted channel. Fluorescent micrographs compare the NPs collected in the outflow from the control channel (top) versus the constricted channel (bottom). Scale bar, 2 μm. (E) Concentration of nanoparticles in endothelial cells lining the downstream area (poststenosis) of the constriction relative to an upstream area. Fluorescence microscopic images show cells from regions before (left) and after (right) the constriction. Scale bar, 20 μm. | Credit: Korin et al (2012)

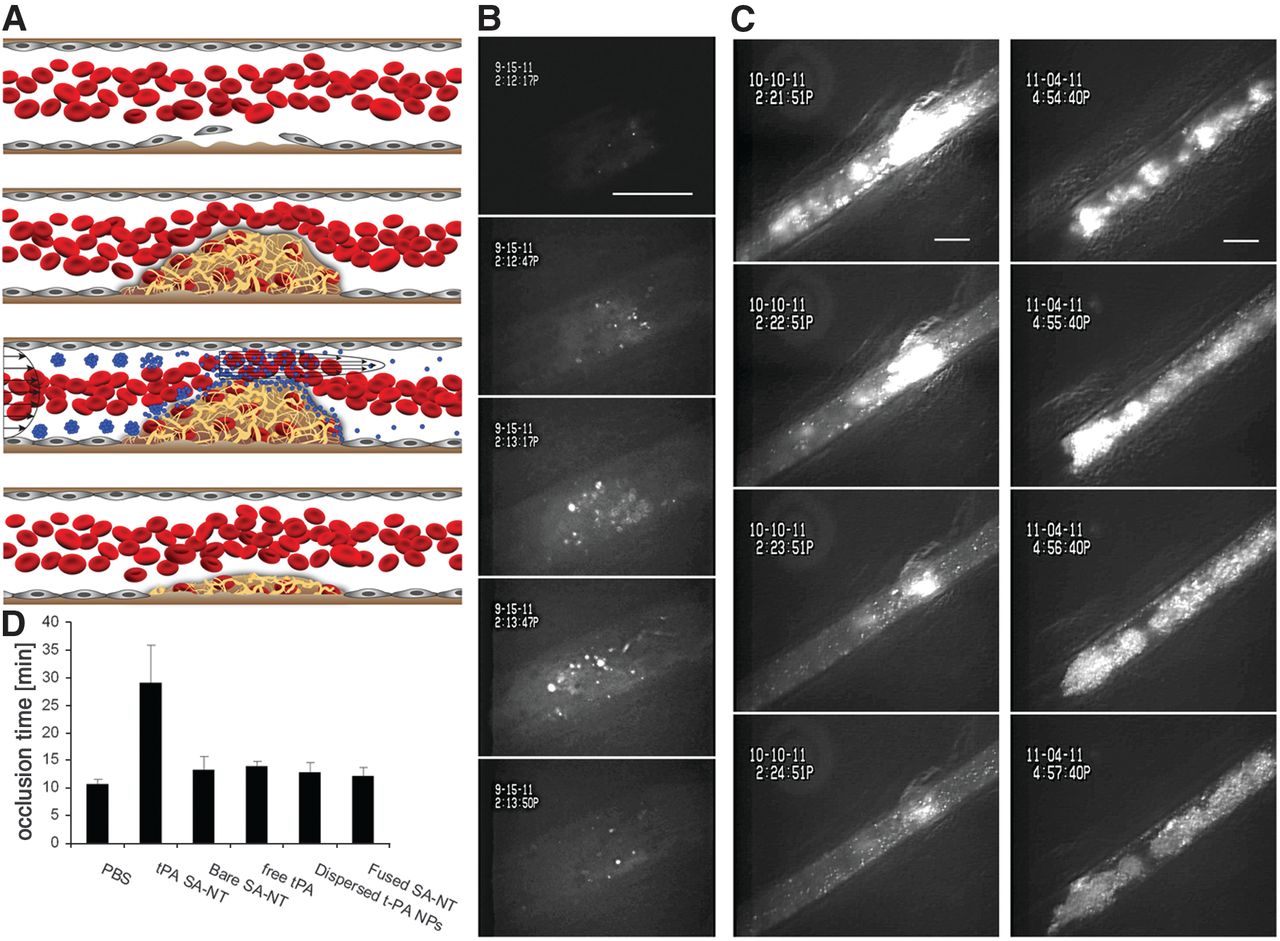
The ability of SA-NTs to dissolve blood clots was tested in vivo using fluorescent tPA-coated nanoparticles in mice. tPA (tissue plasminogen activator) is a thrombolytic agent which has high affinity for a protein involved in the clotting of blood, called fibrin. In this case, they triggered clot formation by injuring the vessel wall by direct exposure to ferric chloride. This lead to the appearance of large blood clots within minutes in injured mesenteric arteries (~100 m diameter, normal wall shear stress ~30 dyne/cm2) that decreased the effective diameter by more than 80% (Fig. 3, B and C) and caused the local shear stress to rise to ~450 dyne/cm2. The fluorescent nanoparticles allowed, on the one hand, the visualization of these lesions (Fig. 3B). On the other hand, they progressively eroded the thrombi, with complete elimination of the obstruction 5 min after SA-NT injection (Fig. 3, B and C). Unobstructed vessels were also monitored during 15 minutes, revealing that the SA-NTs circulated through them without disruption into nanoparticles. In this experiment, tPA nanoparticles from SA-NTs were able to reopen the injured vessel and delay the time to its occlusion for a longer time than PBS (phosphate-buffered saline), and predissociated tPA nanoparticles (Fig. 3, C and D).

Figure 3. (A) Schematic of SA-NTs’ strategy. Ferric chloride injury initiates formation of a thrombus (top) that grows to partially obstruct blood flow (top middle). Injected SA-NTs dissociate into NPs at the thrombus (bottom middle). Accumulation of tPA-coated NPs and binding to the clot at the occlusion site progressively dissolve the obstruction (bottom). (B) Sequential intravital fluorescence microscopic images of a thrombus in a partially occluded mesenteric artery recorded over a 5-min period beginning after bolus injection of fluorescent tPA-coated SA-NTs (1 mg NPs; 50 ng tPA) 8 min after injury initiation. Scale bar, 100 μm. The NPs accumulate at the clot, first visualizing its location and then demonstrating clearance of the clot within 5 min after injection at the bottom. (C) Sequence of intravital fluorescence microscopic images recorded over a 5-min period showing fluorescently labeled platelets accumulated within a forming thrombus that partially occludes a mesenteric artery 8 min after injury. Thrombosis is then treated with injection of either tPA-carrying SA-NTs (50 ng tPA) (left) or PBS (right). Scale bar, 100 μm. The clot on the left is greatly reduced in size within 5 min after SA-NTs injection, whereas the control vessel on the right fully occludes over the same time period. (D) Graph showing occlusion time for different treatments: SA-NTs carrying 50 ng tPA (tPA-SA-NT), soluble tPA (free tPA), uncoated SA-NTs (bare SA-NT), tPA-coated NPs that were artificially dissociated from SA-NTs before injection (dispersed tPA-NPs), and heat-fused NP microaggregates with tPA coating that do not dissociate (fused SA-NT). | Credit: Korin et al. (2012)

Next, they tested SA-NTs for treatment of experimentally induced fibrin clots in vitro, to determine their potential with life-threatening embolic occlusions. Fibrin clots were injected into microfluidic channels with constrictions (80 m high, 500 m wide), and lodged in there partially obstructing the flow (Fig. 4A). An infusion of SA-NTs (100 mg/ml) with tPA (50 ng/ml) at physiological flow rates was able to reduce the clots by one half within an hour of treatment (Fig. 4A). The same treatment with predissociated tPA had less than 5% reduction in clot size.

The same fibrin clots were infused in an ex vivo whole-mouse-lung ventilation-perfusion model. Multiple microemboli appeared (Fig. 4C), causing the pulmonary artery pressure to increase from 8 to 30 mm Hg (Fig. 4E). Then, they perfused the same tPA-coated SA-NTs, that is 100-mg/ml of aggregates containing 50 ng/ml tPA, at physiological flow rate. Experiments showed a >25-fold increase in accumulation of NPs at the occlusions, (Figs. 4, C and D). Within one hour of treatment, the pressure levels of the pulmonary artery went back to normal. The same treatment with predissociated tPA -and even 10 times more- had no significant response (Fig. 4F). To get similar effects to SA-NTs, a 100-times-higher concentration of free tPA had to be administered.

Figure 4. Shear-targeting of a thrombolytic drug to vascular emboli in vitro and therapeutic delivery in a mouse pulmonary embolism model. (A) Time-lapse fluorescence (top) and bright field (bottom) views of artificial microemboli (~250 μm) in a microfluidic channel before (0 min) and 1 or 60 min after injection of SA-NTs coated with tPA (50 ng/ml), showing progressive lysis of the clots over time. Scale bar, 100 μm. (B) Emboli lysis kinetics induced by tPA-coated SA-NTs (50 ng/ml, blue line) compared with soluble tPA (red line). (C) Fluorescence (top) and phase contrast (bottom) views of histological sections of normal (left) versus obstructed (right) pulmonary arteries showing local accumulation of fluorescent NPs within the obstructing emboli in a mouse ex vivo lung ventilation-perfusion model. Scale bar, 100 μm. (D) Accumulation of fluorescent NPs in regions of obstructed versus nonobstructed vessels, as detected with microfluorimetry. (E) Real-time measurements of pulmonary artery pressure in the ex vivo pulmonary embolism model for tPA-coated SA-NTs (blue line) and free tPA (red line). (F) Pulmonary artery pressure within 1 hour for tPA SA-NTs, and free tPA at 50, 500 and 5000 ng/ml concentration. (G) Mice survival curve. | Credit: Korin et al (2012)

The following step was to test SA-NTs in living mice with pulmonary embolism. Fluorescent fibrin clots were infused into the jugular vein of mice, and accumulated in peripheral blood vessels in the lungs. Then, tPa-coated SA-NTs were administered either immediately after clot injection, or 30 minutes later. The experiment showed that tPA-coated SA-NTs reduced by >60% total clot area and clot number when administered immediately after clot infusion, and by >30% when infused after half hour.

Finally, SA-NTs were tested in mice for treatment of life threatening acute massive embolism. They infused a solution of large fibrin clots ( diameter; ~ 100/injection), which accumulated in the main pulmonary arteries. The mice were immediately infused with tPA-coated SA-NTs, or with carrier fluid as a control group, during 45 min. All animals from the control group died within 1 hour after infusion of the clots (Fig. 4G), while 6 out of 7 of the treated mice survived. Moreover, none of the SA-NTs– treated animals displayed any symptoms of respiratory distress after the experiment.

Conclusions

Korin et al. have proved through exhaustive experiments that SA-NTs provide safer thrombolytic therapies with smaller doses without compromising the effectiveness of the treatment. Additionally, thanks to their fluorescent coating, they were proved useful to visually detect occlusions in vessels.

Even though the findings reported in this paper are very promising, the authors are cautious and talk about extensive clinical studies that will be necessary to fully prove this approach. To an outsider to medical research as myself, all these experiments may seem redundant, and is surprising to find out that there are actually hundreds of rules and regulations about all the tests required before being able to use a medical treatment in humans.

References

  1. Netanel Korin, Mathumai Kanapathipillai, Benjamin D. Matthews, Marilena Crescente, Alexander Brill, Tadanori Mammoto, Kaustabh Ghosh, Samuel Jurek, Sidi A. Bencherif, Deen Bhatta, Ahmet U. Coskun, Charles L. Feldman, Denisa D. Wagner, and Donald E. Ingber. Shear-Activated Nanotherapeutics for Drug Targeting to Obstructed Blood Vessels. Science, 10 August 2012: 337 (6095), 738-742.

Written by

Leave a Reply

Your email address will not be published.Required fields are marked *