Transcriptional noise seems to correlate with more closed chromatin environments.
Transcriptional noise seems to correlate with more closed chromatin environments.

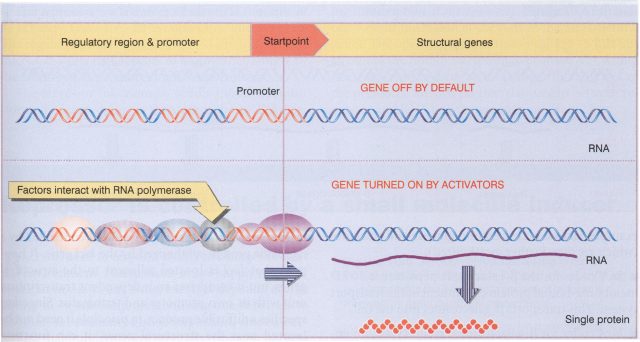
I still remember the order and control exhibited by the chemistry of life that they explained to me in the early years of college. For me, the regulation of gene expression was the supreme paradigm of organization. The promoters, those regulatory sequences preceding genes, were unmistakable ports where plenty of proteins (transcription factors and polymerases) were assembled in complex and majestic order before sailing to the synthesis of a given ribonucleic acid. All that organization still seemed more robust when taking into account the hierarchical structure of chromatin with histones forming neatly arranged nucleosomes. However, all that tight regulation of gene expression shown by classical biochemical techniques was just a simplification. It quickly vanished in more advanced courses with news coming from techniques like flow cytometry and high-throughput microscopy that proved as certain important differences found some time before between single cells from isogenic populations.
Gene expression at the molecular level is a probabilistic process, just the average result of thermodynamically favoured protein actions over those not favoured ones at a given time point. However, these reactions are dependent on relatively small numbers of molecules and any random fluctuation in the process can lead to a considerable amount of noise. What basically means that a “repressed” eukaryotic gene, which ideally should keep silent until next appropriate signal for RNA polymerase assembly and RNA production, can produce variable amounts of transcript out of time. This is referred as transcriptional noise and is one of the sources of the observed non-genetic heterogeneity among individuals of a cell population (from bacteria to eukaryotic cells) that has been extensively documented since the 70´s.
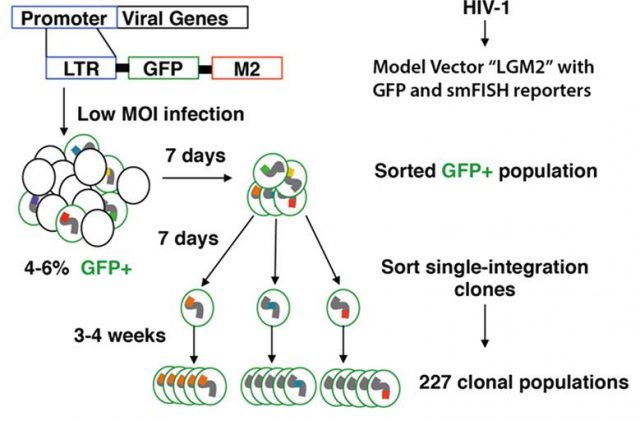
Promoter architecture, transcription factor recruitment and the surrounding chromatin environment regulate gene transcription and transcriptional noise. Nevertheless, the contribution of either one on gene expression noise have been little explored and with slightly conflicting results. Shedding some more information on the matter Dey and coworkers published a paper early this year1. First they use a high-throughput approach to analyzing gene expression mean and noise using clones of Jurkat T cells bearing, across large diversity of genomic locations, a single-integrated dual protein (GFP) and RNA (M2 smFISH) reporter expressed under HIV-1 LTR promoter (Figure 1).

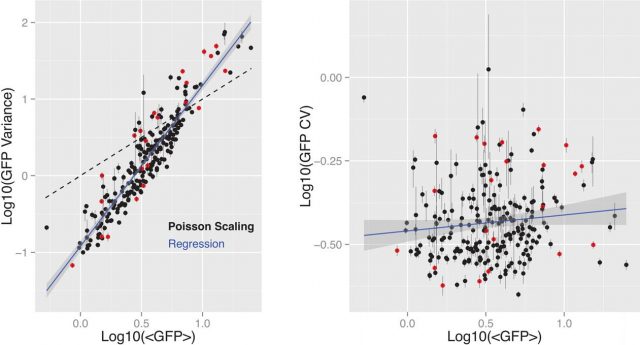
Using flow cytometry to quantify the GFP fluorescence among thousands of cells from each clone they obtained the distribution of the mean expression level and variability within each clone. The observed distribution of these data was tested against two basic models of gene expression: one was constant-rate Poisson process where the promoter is always in an “ON” state and the variance distribution scales linearly with mean expression, while the coefficient of variation (CV; here indicating expression noise) would decrease inversely proportional to square root of the mean. The other was a non-Poissonian process where the RNA is produced in unusual bursts emerging from stochastic promoter transitions from ‘Off’ to ‘On’ state, where the variance shows a power-law relationship with the mean. After testing, it was found that the relationship between GFP mean expression and variance was consistent with the second model, where also the coefficient of variation (expression noise) was uncorrelated with the mean (figure 2). Which suggested that gene expression mean and noise across integration positions are controlled by different underlying processes.

Afterwards, given that measuring protein level is an indirect way of quantify RNA production, and in order to evaluate any influence of post-transductional events in the mean to noise relationships determined above, they selected a representative subset of clones to perform single molecule fluorescence in situ hybridization (smFISH) for quantifying the exact number of RNA molecules per cell and determine the relationships between RNA expression mean variance and RNA expression Noise. They found that the RNA distributions were quite similar to the distributions observed for the GFP reporter protein. RNA variance and mean also followed a power-law relationship and RNA expression noise lacked a meaningful correlation with RNA expression mean. Which was also congruent with the second model proposed above. Furthermore, a two-state transcription model fitted by maximum-likelihood to the parameters from the subset of clones analyzed with smFISH was able to explain gene expression mean and expression noise by burst size (the number of RNA transcripts generated by a switched-On promoter) and burst frequency (rate of promoter Off-On transitions). More precisely, burst size was strongly correlated with RNA expression level and transcriptional noise was inversely correlated with burst frequency.
Therefore, a process controlling promoter-On rate (burst frequency) could be the tuner of transcriptional noise and, at the same time, should be smilingly independent of those processes controlling the amount of RNA molecules produced in an activation event. The nucleosome layout at the transcription start site in the typical eukaryotic TATA-containing promoters is an already known gene expression regulator. While certain open nucleosome dispositions at the promoter allow transcription; others more closed ones avoid gene expression. Thus, chromatin density at the regulatory regions could determine the level of transcriptional noise. In order to test that, they measured the chromatin accessibility (by DNase I sensitivity) at the HIV-1 LTR promoter driving the expression of the reporters for 6 pairs of clones, paired by similar mean RNA/protein production but having different expression noise level throughout different genomic locations (figure 3). They show that the chromatin inaccessibility at the promoter is higher in those clones with high transcriptional noise compared with clones with low transcriptional noise, which show also more accessible hypersensitive sites (HSS; inter-nucleosome regions). Additionally, the chromatin inaccessibility at the transcription start site (TSS) was inversely correlated to the promoter-On rate (Burst frequency), but uncorrelated the number of RNA transcripts generated (burst size). Hence, pointing out that reporter sequences integrated into denser chromatin suffer fewer events of promoter activation but more gene transcriptional noise. On the contrary, those reporter sequences integrated into more open regions are transcribed more frequently showing less noise. Thus, suggesting that chromatin environment could account for promoter-ON rates and transcriptional noise but does not explain a number of RNA transcripts generated in each activation event.

The idea of chromatin as the main gatekeeper of transcriptional noise is seductive because of variety of implications. Mechanistically, it could contribute to explain the evolution of gene expression. Also, it could facilitate the understanding of cell differentiation or phenotypic drift within isogenic populations either natural or pathogenic. However, this study conflicts with previous studies where burst frequency and size seem to be correlated, where protein expression noise scales with its abundance, or where the chromatin environment appears to play only a secondary role. Therefore, these findings should be viewed with caution until additional work can discern whether there is a general trend in the modulation of transcriptional noise or otherwise depends on experimental system and the models used.
References
- Siddharth S Dey et al (2015) Orthogonal control of expression mean and variance by epigenetic features at different genomic loci Mol. Syst. Biol. DOI: 10.15252/msb.20145704 ↩